
+7.27% for The Graph — daily up move tries to counter ongoing bearish momentum

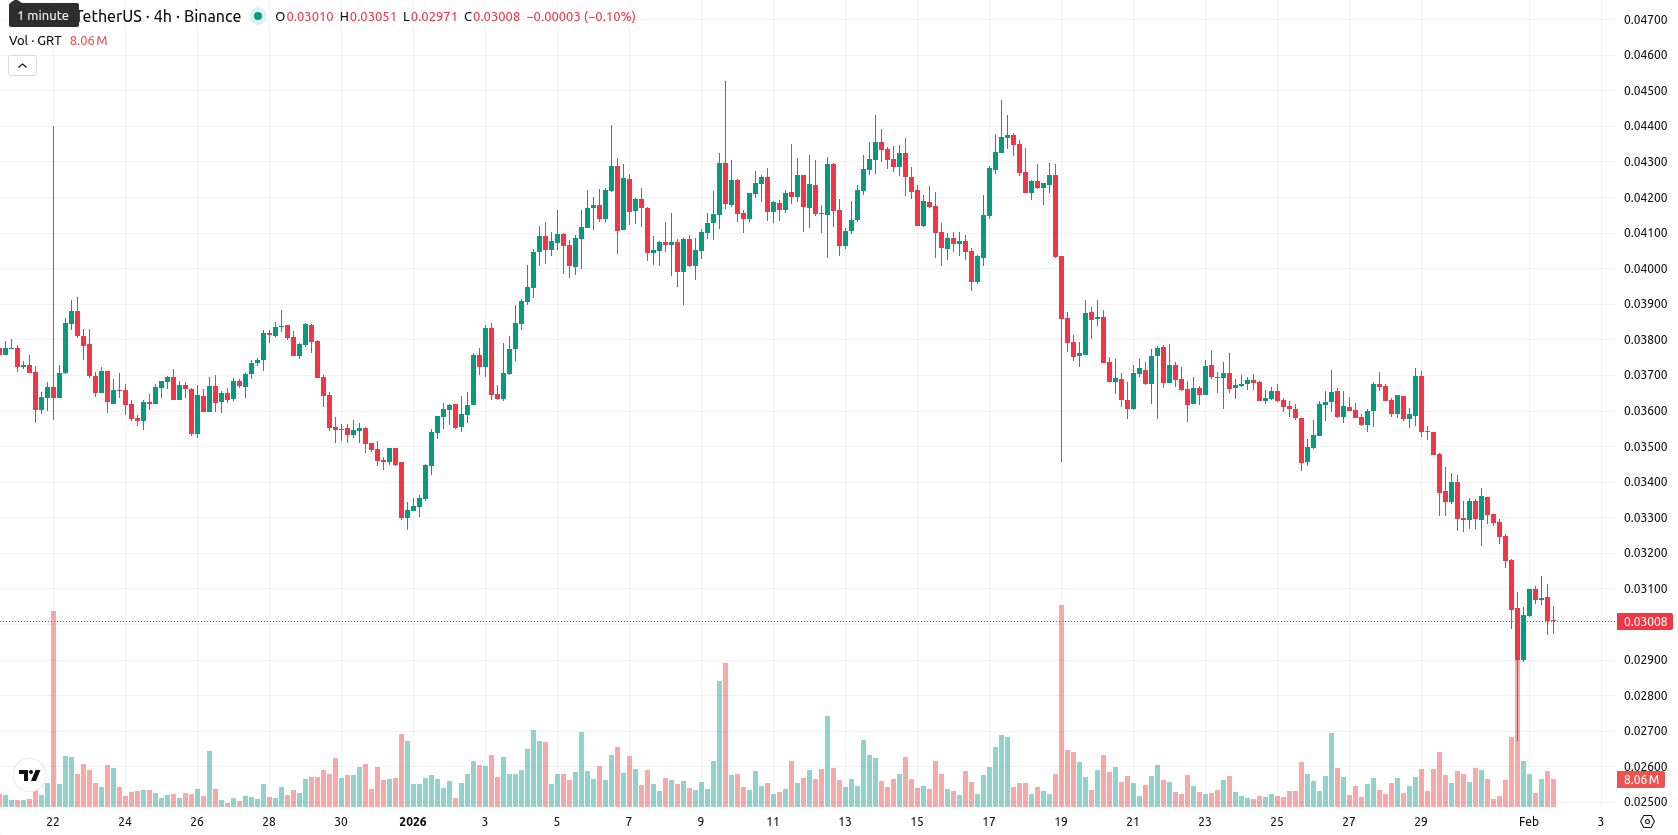
The Graph (GRT) is currently trading at $0.030121, below all key Moving Averages: MA-20 at $0.03775010, MA-50 at $0.03810844, and MA-200 at $0.06812981, which signals that short-, medium-, and long-term momentum remains under pressure from sellers. The nearest dynamic resistance is the Ichimoku Kijun at $0.03635050, while no significant support is indicated nearby.
Highlights
- GRT is trading at $0.030121, below short-, medium-, and long-term Moving Averages (MA-20: $0.03775010, MA-50: $0.03810844, MA-200: $0.06812981), indicating sustained bearish momentum.
- Momentum indicators such as RSI (29.57), Stochastic RSI, and CCI are deeply oversold, suggesting potential for a short-term rebound but not yet confirmed by momentum signals.
- For the next five trading days, GRT is expected to consolidate between $0.02750 and $0.03300, with a decisive move above $0.03635050 required to shift trend, but sellers remain dominant.
Oversold readings suggest rebound risk as sellers retain control
Momentum conditions are bearish, with both the MACD and ADX showing weak downside pressure on the daily timeframe. Oversold signals are prominent: the RSI is at 29.57, Stochastic RSI is at its lowest, and CCI reads deeply oversold, all suggesting a short-term rebound could be possible but is not yet confirmed by momentum. Bull/Bear Power remains negative, confirming sellers' dominance intraday, while the Awesome Oscillator also supports the bearish structure. Today’s price opened moderately higher without a gap and is currently trading around mid-range of the session after an intraday move up 7.27%. Volatility is moderate. Price action has shown some post-open strength toward session highs, but the overall tone remains cautious, with momentum indicators and price action largely in sync.
Sideways consolidation likely as upside faces strong resistance
For the next five trading days, GRT is expected to trade between $0.02750 and $0.03300, reflecting a typical volatility band relative to current levels. There is a very low probability (less than 20%) of a sustained price increase, making a further decline the more likely scenario. The baseline scenario is for GRT to consolidate sideways within the projected range. A bullish scenario would require a decisive move above $0.03635050, but such a move faces significant resistance; a bearish breakdown below $0.02750 would open the door to further losses, as reinforced by negative momentum signals and persistent selling pressure across daily and weekly indicators.
Previously it was reported that The Graph remains in a pronounced downtrend as it trades well below all major moving averages, with persistent seller dominance and no nearby dynamic support. Key indicators including RSI, MACD, and other momentum measures confirm oversold conditions, while resistance at the Ichimoku Kijun limits rebound prospects and sustained downside risk prevails absent a decisive bullish reversal.


-
 Afghanistan
-
 Albania
-
 Algeria
-
 Angola
-
 Argentina
-
 Armenia
-
 Australia
-
 Austria
-
 Azerbaijan
-
 Bahamas
-
 Bahrain
-
 Bangladesh
-
 Belarus
-
 Belgium
-
 Bolivia
-
 Botswana
-
 Brazil
-
 Brunei
-
 Bulgaria
-
 Cambodia
-
 Cameroon
-
 Canada
-
 Chile
Chile
-
 China
China
-
 Colombia
-
 Congo
Congo
-
 Costa Rica
-
 Cote d'Ivoire
-
 Croatia
-
 Cuba
Cuba
-
 Cyprus
-
 Czechia
-
 DR Congo
-
 Denmark
-
 Dominican Republic
-
 Ecuador
-
 Egypt
Egypt
-
 El Salvador
-
 Estonia
-
 Eswatini
-
 Ethiopia
-
 Finland
-
 France
-
 Georgia
-
 Germany
-
 Ghana
Ghana
-
 Greece
-
 Haiti
Haiti
-
 Hong Kong
-
 Hungary
-
 India
India
-
 Indonesia
-
 Iran, Islamic republic
-
 Iraq
Iraq
-
 Ireland
-
 Israel
-
 Italy
Italy
-
 Jamaica
-
 Japan
Japan
-
 Jordan
-
 Kazakhstan
-
 Kenya
Kenya
-
 Korea
Korea
-
 Kuwait
-
 Kyrgyzstan
-
 Laos
Laos
-
 Latvia
-
 Lebanon
-
 Lesotho
-
 Libya
Libya
-
 Lithuania
-
 Luxembourg
-
 Madagascar
-
 Malaysia
-
 Malta
Malta
-
 Mauritius
-
 Mexico
-
 Moldova
-
 Mongolia
-
 Montenegro
-
 Morocco
-
 Mozambique
-
 Myanmar
-
 Namibia
-
 Nepal
Nepal
-
 Netherlands
-
 New Zealand
-
 Nigeria
-
 North Macedonia
-
 Norway
-
 Oman
Oman
-
 Pakistan
-
 Palestine
-
 Panama
-
 Papua New Guinea
-
 Paraguay
-
 Peru
Peru
-
 Philippines
-
 Poland
-
 Portugal
-
 Puerto Rico
-
 Qatar
Qatar
-
 Reunion
-
 Romania
-
 Rwanda
-
 Saudi Arabia
-
 Serbia
-
 Singapore
-
 Slovakia
-
 Slovenia
-
 Somalia
-
 South Africa
-
 Spain
Spain
-
 Sri Lanka
-
 Sweden
-
 Switzerland
-
 Syria
Syria
-
 Taiwan
-
 Tajikistan
-
 Tanzania
-
 Thailand
-
 Trinidad and Tobago
-
 Tunisia
-
 Turkey
-
 UAE
UAE
-
 Uganda
-
 Ukraine
-
 United Kingdom
-
United States
-
 Uruguay
-
 Uzbekistan
-
 Venezuela
-
 Vietnam
-
 Yemen
Yemen
-
 Zambia
-
 Zimbabwe
- Forex
- Crypto
