
The Graph: Intensifying bearish structure drives intraday losses and weak rebound prospects

The Graph (GRT) has dropped well below the MA-20 ($0.038316), MA-50 ($0.038318), and MA-200 ($0.068494), indicating sellers dominate across short-, medium-, and long-term horizons. The next major resistance is located at the Ichimoku Kijun on the daily chart ($0.038755), with little sign of dynamic support close by.
Highlights
- The Graph (GRT) trades well below the MA-20 ($0.038316), MA-50 ($0.038318), and MA-200 ($0.068494), confirming pervasive bearish momentum across all timeframes.
- Momentum gauges including MACD, RSI (34.49), Commodity Channel Index (–128.5), and Stochastic RSI at zero indicate extreme oversold conditions with no convincing signs of a reversal.
- Key resistance sits at the daily Ichimoku Kijun ($0.038755), while a breakdown below $0.0275 could trigger further declines; near-term trading likely constrained within $0.0275–$0.0330.
Persistent downside as oversold indicators align with intraday volatility
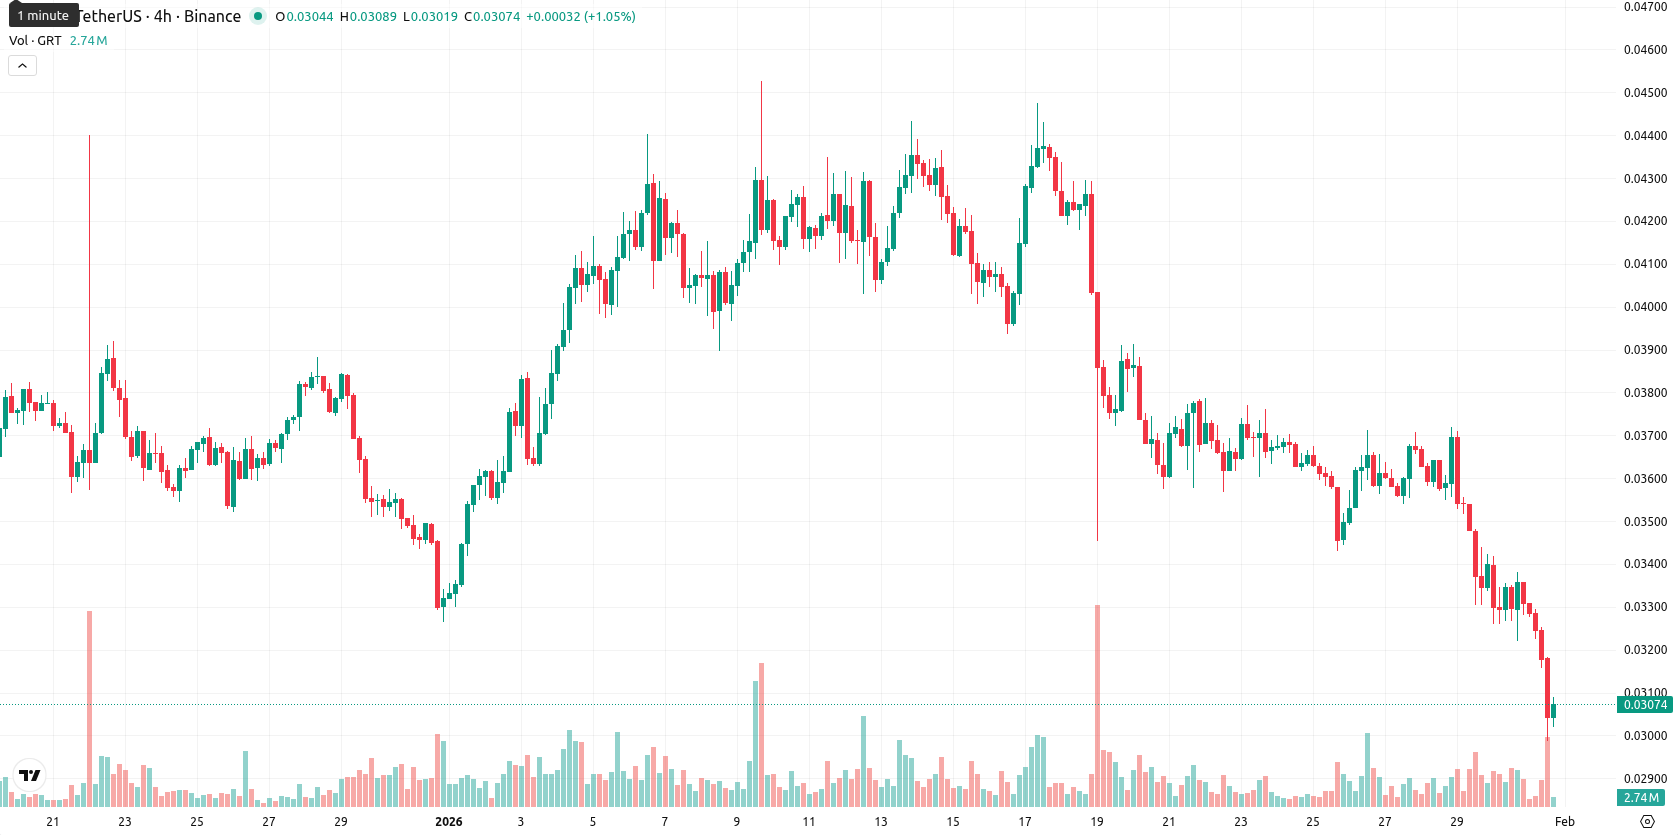
Momentum remains weak as the MACD is negative and confirms a sell signal, while ADX suggests a subdued trend. Both the RSI (34.49) and Commodity Channel Index (–128.5) are in oversold territory, joined by the Stochastic RSI, which is pinned at zero — reflecting oversold conditions but weak buying conviction. Bull/Bear Power stays negative, reinforcing intraday seller control, and the Awesome Oscillator also supports the bearish outlook. After a slight gap up from the previous close ($0.03296) to the open ($0.033152), the price slid 7.98% intraday, currently near today’s low ($0.02994), which reflects high volatility and persistent pressure after the open; all intraday indicators point to sustained downside momentum with no clear reversal signals yet.
Low rebound odds as bearish structure contains price within volatility band
Looking ahead, a typical weekly trading range for GRT is estimated at $0.0275 to $0.0330, keeping current price action within a volatility band relative to current levels. The probability of a price increase in the coming week is very low (less than 20%), while further declines are much more likely given the unbroken bearish structure on all daily and weekly indicators. The baseline scenario envisions GRT fluctuating sideways within this corridor. A bullish turnaround would require a strong break above the Ichimoku Kijun resistance near $0.0388, while a bearish scenario would unfold if the price falls below $0.0275, exposing further downside risk.
Last time, analysts noted that The Graph is under persistent selling pressure, trading well below its major moving averages, with daily indicators such as RSI and MACD remaining firmly bearish and momentum signals subdued. Downside risk remains elevated, as sellers dominate intraday levels and any sustained recovery is unlikely unless the price reclaims key resistance near the Ichimoku Kijun.


-
 Afghanistan
-
 Albania
-
 Algeria
-
 Angola
-
 Argentina
-
 Armenia
-
 Australia
-
 Austria
-
 Azerbaijan
-
 Bahamas
-
 Bahrain
-
 Bangladesh
-
 Belarus
-
 Belgium
-
 Bolivia
-
 Botswana
-
 Brazil
-
 Brunei
-
 Bulgaria
-
 Cambodia
-
 Cameroon
-
 Canada
-
 Chile
Chile
-
 China
China
-
 Colombia
-
 Congo
Congo
-
 Costa Rica
-
 Cote d'Ivoire
-
 Croatia
-
 Cuba
Cuba
-
 Cyprus
-
 Czechia
-
 DR Congo
-
 Denmark
-
 Dominican Republic
-
 Ecuador
-
 Egypt
Egypt
-
 El Salvador
-
 Estonia
-
 Eswatini
-
 Ethiopia
-
 Finland
-
 France
-
 Georgia
-
 Germany
-
 Ghana
Ghana
-
 Greece
-
 Haiti
Haiti
-
 Hong Kong
-
 Hungary
-
 India
India
-
 Indonesia
-
 Iran, Islamic republic
-
 Iraq
Iraq
-
 Ireland
-
 Israel
-
 Italy
Italy
-
 Jamaica
-
 Japan
Japan
-
 Jordan
-
 Kazakhstan
-
 Kenya
Kenya
-
 Korea
Korea
-
 Kuwait
-
 Kyrgyzstan
-
 Laos
Laos
-
 Latvia
-
 Lebanon
-
 Lesotho
-
 Libya
Libya
-
 Lithuania
-
 Luxembourg
-
 Madagascar
-
 Malaysia
-
 Malta
Malta
-
 Mauritius
-
 Mexico
-
 Moldova
-
 Mongolia
-
 Montenegro
-
 Morocco
-
 Mozambique
-
 Myanmar
-
 Namibia
-
 Nepal
Nepal
-
 Netherlands
-
 New Zealand
-
 Nigeria
-
 North Macedonia
-
 Norway
-
 Oman
Oman
-
 Pakistan
-
 Palestine
-
 Panama
-
 Papua New Guinea
-
 Paraguay
-
 Peru
Peru
-
 Philippines
-
 Poland
-
 Portugal
-
 Puerto Rico
-
 Qatar
Qatar
-
 Reunion
-
 Romania
-
 Rwanda
-
 Saudi Arabia
-
 Serbia
-
 Singapore
-
 Slovakia
-
 Slovenia
-
 Somalia
-
 South Africa
-
 Spain
Spain
-
 Sri Lanka
-
 Sweden
-
 Switzerland
-
 Syria
Syria
-
 Taiwan
-
 Tajikistan
-
 Tanzania
-
 Thailand
-
 Trinidad and Tobago
-
 Tunisia
-
 Turkey
-
 UAE
UAE
-
 Uganda
-
 Ukraine
-
 United Kingdom
-
United States
-
 Uruguay
-
 Uzbekistan
-
 Venezuela
-
 Vietnam
-
 Yemen
Yemen
-
 Zambia
-
 Zimbabwe
- Forex
- Crypto
