
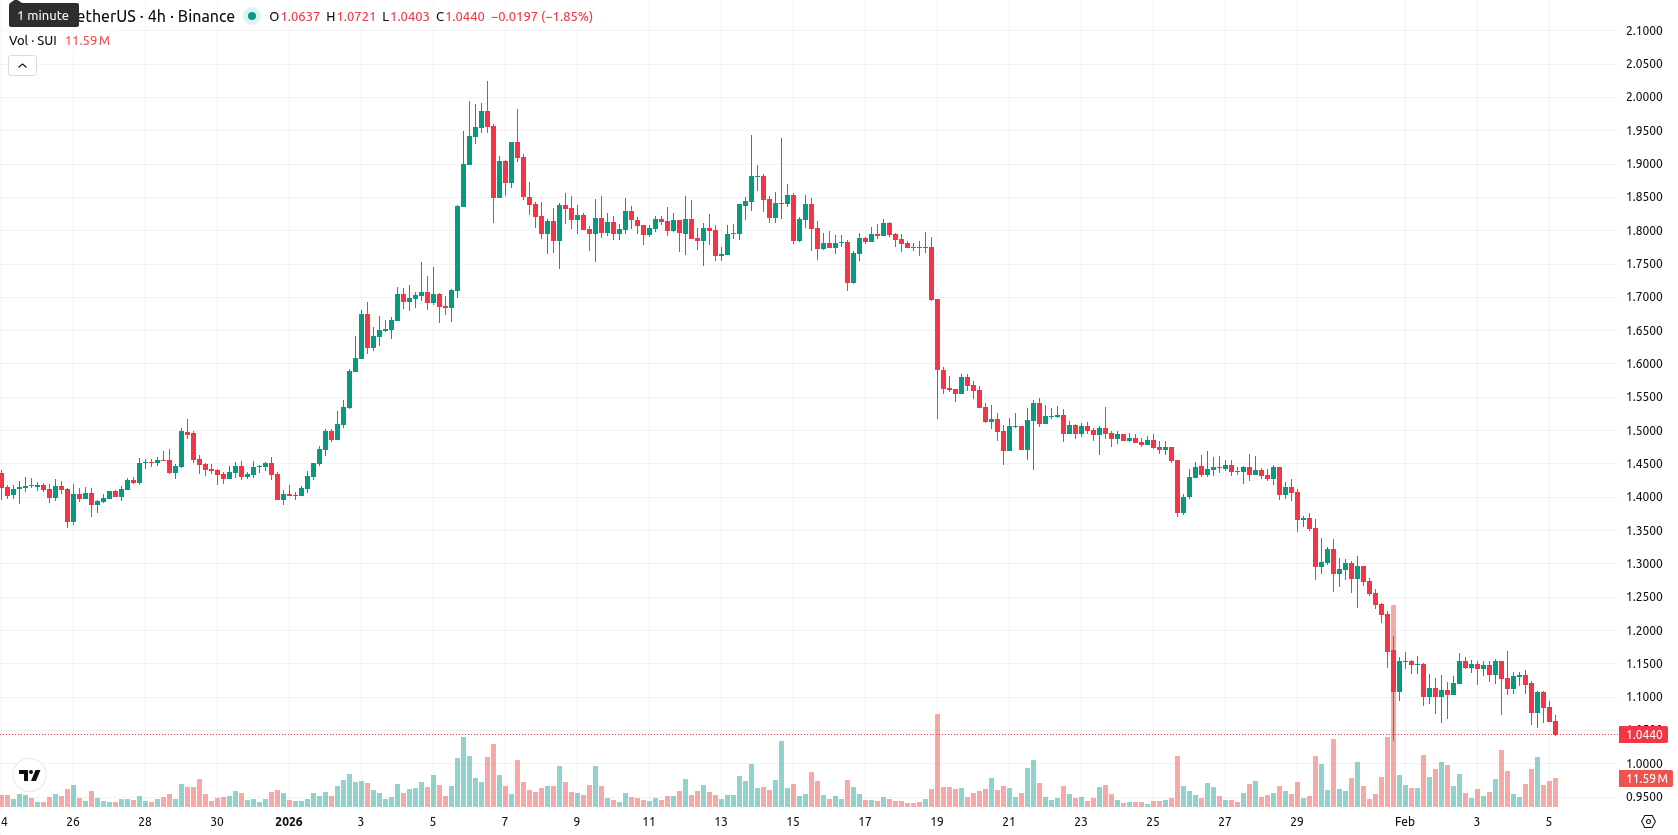
-7.19% for Sui — selling pressure intensifies as no positive news emerges

Sui (SUI) is trading at $1.0427, showing a significant daily drop of 7.19%. The asset is currently positioned well below its MA-20 ($1.4091), MA-50 ($1.5229), and MA-200 ($2,5265), highlighting persistent bearish momentum across all major timeframes.
Highlights
- The Sui blockchain ecosystem currently has no significant regulatory, tokenomic, or technological updates to materially alter its investment outlook.
- Recent SUI price action shows strong bearish momentum, with a daily drop of 7.19% to $1.0427, trading below all key moving averages.
- Support lies just above $1.0427 with resistance at $1.4879; consensus expects a price range of $0.95–$1.15 next week amid persistent seller dominance.
Lack of new catalysts tempers sentiment despite ecosystem activity
Recent activity within the Sui blockchain ecosystem has been notable, reflecting broader trends impacting major blockchain networks. Currently, there are no significant regulatory, tokenomic, or technological updates for Sui that would materially alter its outlook.
Oversold signals and strong selling reflect persistent intraday pressure
Momentum indicators reinforce the strong bearish setup: the MACD and ADX demonstrate lasting selling momentum, while the RSI (24.83), Stochastic RSI (17.45), and CCI (–126.99) all flag oversold conditions. Bull/Bear Power remains negative, confirming seller dominance during intraday trading. The Awesome Oscillator also supports the ongoing downtrend. Intraday price action is marked by notable volatility, with SUI closing near session lows and aligning with persistent negative momentum signals.
Sideways trading expected as sellers dominate and upside odds fade
Over the coming week, typical volatility suggests SUI will likely oscillate within a range of $0.95 to $1.15. Odds of a strong upward move are less than 20%, supporting a further decline as the more probable scenario according to weekly indicators. The baseline expectation is for sideways action as sellers and bargain hunters contest control within this corridor. A clear bullish turnaround would require a sustained breakout above the $1.15 – $1.20 resistance, while a continued downturn could see SUI falling below the $0.95 support if negative momentum endures.
Last time, analysts noted that Sui remained under sustained bearish pressure, trading sideways below all key weekly moving averages and facing strong sell-side control amid oversold weekly RSI and bearish momentum indicators such as MACD and ADX. The asset was expected to consolidate within a narrow range, with volatility driven by a pending token unlock and a lack of immediate technical support above, while downside risks intensified if psychological support at the $1 level failed.


Latest SUI News


-
 Afghanistan
-
 Albania
-
 Algeria
-
 Angola
-
 Argentina
-
 Armenia
-
 Australia
-
 Austria
-
 Azerbaijan
-
 Bahamas
-
 Bahrain
-
 Bangladesh
-
 Belarus
-
 Belgium
-
 Bolivia
-
 Botswana
-
 Brazil
-
 Brunei
-
 Bulgaria
-
 Cambodia
-
 Cameroon
-
 Canada
-
 Chile
Chile
-
 China
China
-
 Colombia
-
 Congo
Congo
-
 Costa Rica
-
 Cote d'Ivoire
-
 Croatia
-
 Cuba
Cuba
-
 Cyprus
-
 Czechia
-
 DR Congo
-
 Denmark
-
 Dominican Republic
-
 Ecuador
-
 Egypt
Egypt
-
 El Salvador
-
 Estonia
-
 Eswatini
-
 Ethiopia
-
 Finland
-
 France
-
 Georgia
-
 Germany
-
 Ghana
Ghana
-
 Greece
-
 Haiti
Haiti
-
 Hong Kong
-
 Hungary
-
 India
India
-
 Indonesia
-
 Iran, Islamic republic
-
 Iraq
Iraq
-
 Ireland
-
 Israel
-
 Italy
Italy
-
 Jamaica
-
 Japan
Japan
-
 Jordan
-
 Kazakhstan
-
 Kenya
Kenya
-
 Korea
Korea
-
 Kuwait
-
 Kyrgyzstan
-
 Laos
Laos
-
 Latvia
-
 Lebanon
-
 Lesotho
-
 Libya
Libya
-
 Lithuania
-
 Luxembourg
-
 Madagascar
-
 Malaysia
-
 Malta
Malta
-
 Mauritius
-
 Mexico
-
 Moldova
-
 Mongolia
-
 Montenegro
-
 Morocco
-
 Mozambique
-
 Myanmar
-
 Namibia
-
 Nepal
Nepal
-
 Netherlands
-
 New Zealand
-
 Nigeria
-
 North Macedonia
-
 Norway
-
 Oman
Oman
-
 Pakistan
-
 Palestine
-
 Panama
-
 Papua New Guinea
-
 Paraguay
-
 Peru
Peru
-
 Philippines
-
 Poland
-
 Portugal
-
 Puerto Rico
-
 Qatar
Qatar
-
 Reunion
-
 Romania
-
 Rwanda
-
 Saudi Arabia
-
 Serbia
-
 Singapore
-
 Slovakia
-
 Slovenia
-
 Somalia
-
 South Africa
-
 Spain
Spain
-
 Sri Lanka
-
 Sweden
-
 Switzerland
-
 Syria
Syria
-
 Taiwan
-
 Tajikistan
-
 Tanzania
-
 Thailand
-
 Trinidad and Tobago
-
 Tunisia
-
 Turkey
-
 UAE
UAE
-
 Uganda
-
 Ukraine
-
 United Kingdom
-
United States
-
 Uruguay
-
 Uzbekistan
-
 Venezuela
-
 Vietnam
-
 Yemen
Yemen
-
 Zambia
-
 Zimbabwe
- Forex
- Crypto
