
Bearish momentum builds across indicators — Algorand slides 7.7%

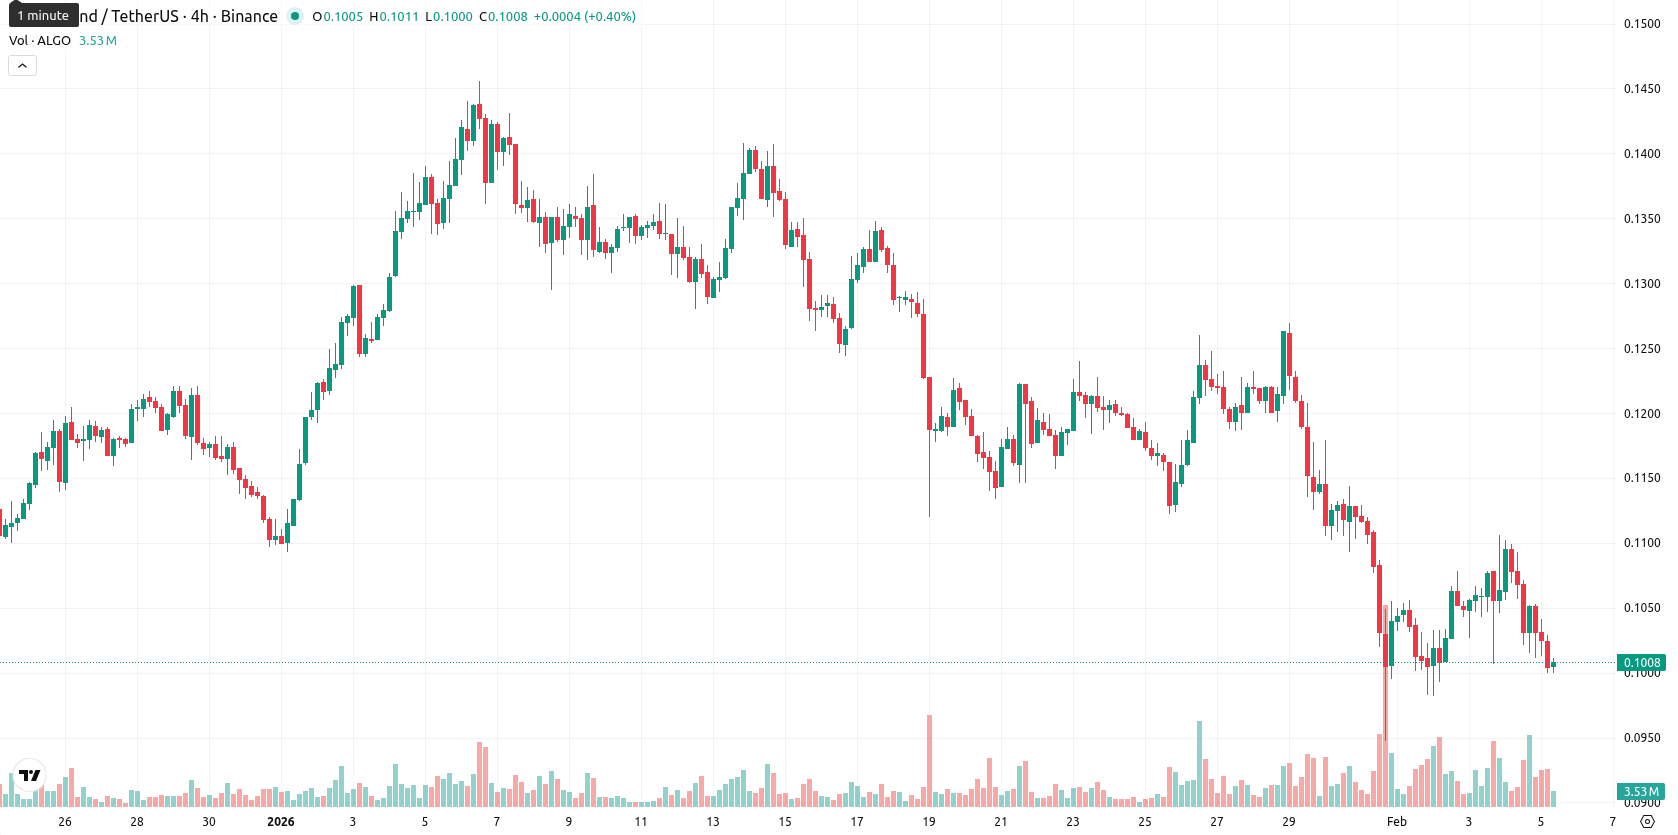
Algorand (ALGO) is trading at $0.1007, noticeably below its MA-20 ($0.1163), MA-50 ($0.1207), and MA-200 ($0.1845), which confirms strong downward pressure across all timeframes.
Highlights
- ALGO is trading at $0.1007, well below its MA-20 ($0.1163), MA-50 ($0.1207), and MA-200 ($0.1845), confirming strong multi-timeframe bearish pressure.
- Momentum indicators (MACD, ADX at 22.24, RSI at 37, CCI at -114) and negative Bull/Bear Power all indicate persistent downside and oversold conditions.
- Expect ALGO to fluctuate between $0.094 and $0.108 over the next five days; a drop below $0.094 signals further downside, while resistance stands at $0.1178.
Downtrend persists as oversold signals fail to spur rebound
The nearest dynamic resistance is defined by the Ichimoku Kijun at $0.1178, while support is found near recent intraday lows around $0.1000; there is no crossover event to note. Momentum indicators on the daily chart, such as the MACD (Sell) and ADX (Sell, 22.24), signal persistent bearish momentum. The RSI (37) and Commodity Channel Index (Oversold at -114) both highlight increasing oversold conditions, while the Stochastic RSI also signals further downside, indicating a lack of bullish reversal so far. Bull/Bear Power remains negative, reflecting continued seller dominance intraday; the Awesome Oscillator also aligns with this downtrend. ALGO opened with a gap down (previous close $0.1091, open $0.1031) and is now trading near the session’s low within a narrow daily range, as volatility is moderate; pressure after the open persists and there is no sign of rebound.
Further downside likely as technical signals point to low recovery odds
For the next five trading days, expect ALGO to fluctuate between $0.094 and $0.108, reflecting a typical volatility band relative to current levels. All major weekly indicators — MA-50, RSI, ADX, and MACD — are signaling “Sell,” so the probability of a price increase is very low (less than 20%), making a further decline much more likely. Baseline scenario: the price remains sideways between $0.094 and $0.108. Bullish case: a recovery above $0.108 could trigger a move toward resistance at $0.117. Bearish case: a decisive drop below $0.094 would expose further downside, as oversold conditions have not led to sustainable buying so far.
Previously it was reported that Algorand continues to face significant bearish momentum, trading below all major moving averages, with oversold readings on the RSI, CCI, and Stochastic RSI reinforcing a prevailing downtrend. The asset remains capped by resistance from the Ichimoku Kijun, with limited support nearby and technical indicators suggesting further downside risk in the near term.


-
 Afghanistan
-
 Albania
-
 Algeria
-
 Angola
-
 Argentina
-
 Armenia
-
 Australia
-
 Austria
-
 Azerbaijan
-
 Bahamas
-
 Bahrain
-
 Bangladesh
-
 Belarus
-
 Belgium
-
 Bolivia
-
 Botswana
-
 Brazil
-
 Brunei
-
 Bulgaria
-
 Cambodia
-
 Cameroon
-
 Canada
-
 Chile
Chile
-
 China
China
-
 Colombia
-
 Congo
Congo
-
 Costa Rica
-
 Cote d'Ivoire
-
 Croatia
-
 Cuba
Cuba
-
 Cyprus
-
 Czechia
-
 DR Congo
-
 Denmark
-
 Dominican Republic
-
 Ecuador
-
 Egypt
Egypt
-
 El Salvador
-
 Estonia
-
 Eswatini
-
 Ethiopia
-
 Finland
-
 France
-
 Georgia
-
 Germany
-
 Ghana
Ghana
-
 Greece
-
 Haiti
Haiti
-
 Hong Kong
-
 Hungary
-
 India
India
-
 Indonesia
-
 Iran, Islamic republic
-
 Iraq
Iraq
-
 Ireland
-
 Israel
-
 Italy
Italy
-
 Jamaica
-
 Japan
Japan
-
 Jordan
-
 Kazakhstan
-
 Kenya
Kenya
-
 Korea
Korea
-
 Kuwait
-
 Kyrgyzstan
-
 Laos
Laos
-
 Latvia
-
 Lebanon
-
 Lesotho
-
 Libya
Libya
-
 Lithuania
-
 Luxembourg
-
 Madagascar
-
 Malaysia
-
 Malta
Malta
-
 Mauritius
-
 Mexico
-
 Moldova
-
 Mongolia
-
 Montenegro
-
 Morocco
-
 Mozambique
-
 Myanmar
-
 Namibia
-
 Nepal
Nepal
-
 Netherlands
-
 New Zealand
-
 Nigeria
-
 North Macedonia
-
 Norway
-
 Oman
Oman
-
 Pakistan
-
 Palestine
-
 Panama
-
 Papua New Guinea
-
 Paraguay
-
 Peru
Peru
-
 Philippines
-
 Poland
-
 Portugal
-
 Puerto Rico
-
 Qatar
Qatar
-
 Reunion
-
 Romania
-
 Rwanda
-
 Saudi Arabia
-
 Serbia
-
 Singapore
-
 Slovakia
-
 Slovenia
-
 Somalia
-
 South Africa
-
 Spain
Spain
-
 Sri Lanka
-
 Sweden
-
 Switzerland
-
 Syria
Syria
-
 Taiwan
-
 Tajikistan
-
 Tanzania
-
 Thailand
-
 Trinidad and Tobago
-
 Tunisia
-
 Turkey
-
 UAE
UAE
-
 Uganda
-
 Ukraine
-
 United Kingdom
-
United States
-
 Uruguay
-
 Uzbekistan
-
 Venezuela
-
 Vietnam
-
 Yemen
Yemen
-
 Zambia
-
 Zimbabwe
- Forex
- Crypto
