
VeChain drops as bearish momentum intensifies below key moving averages

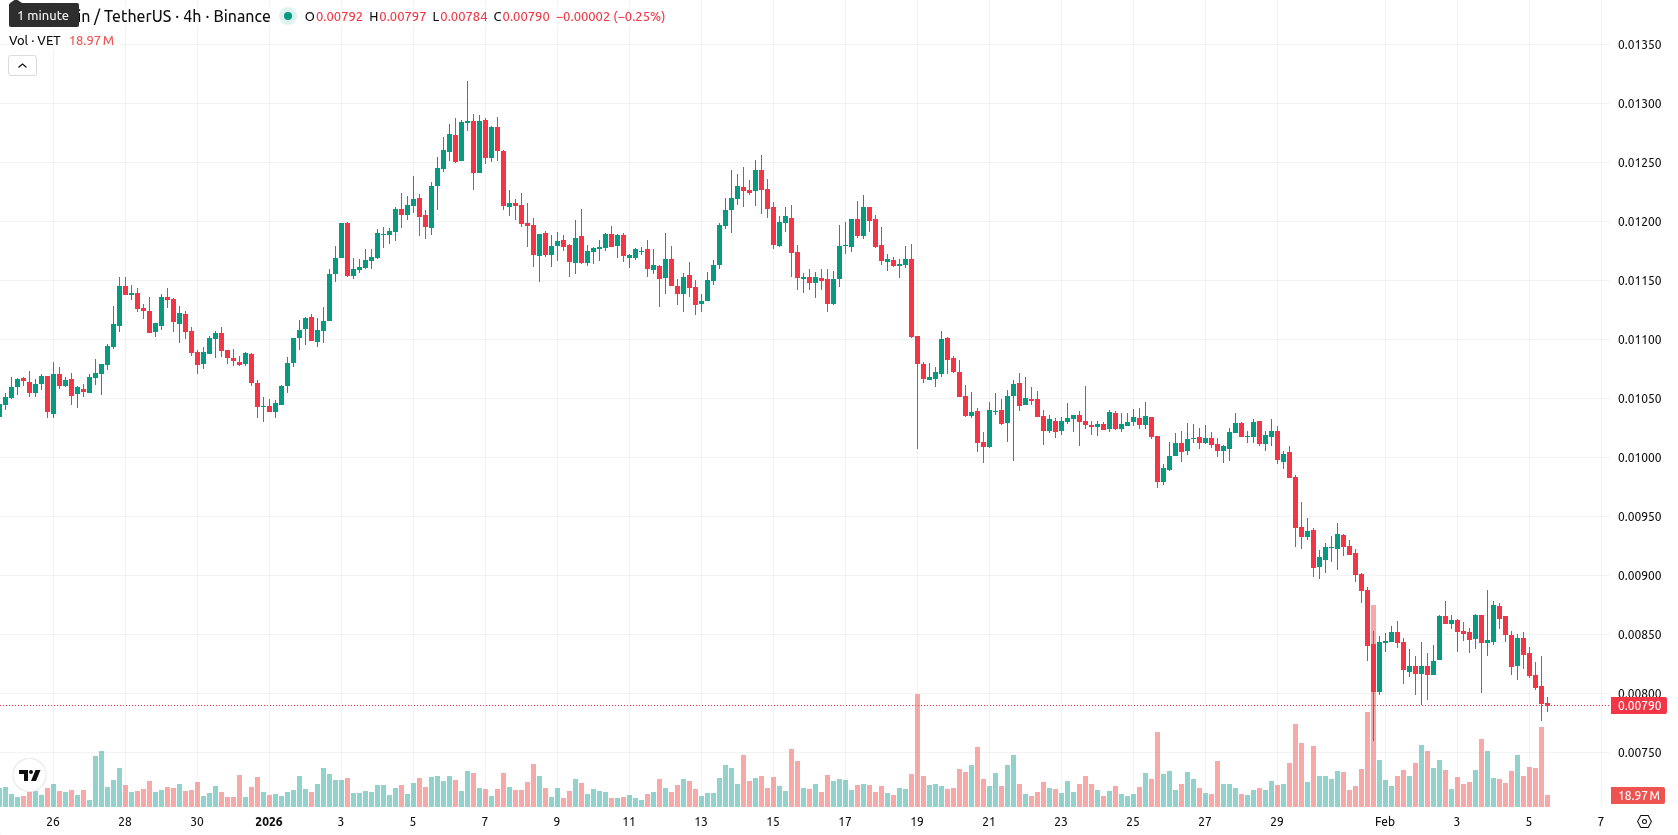
VeChain (VET) is trading at $0.007861, which is well below its MA-20 ($0.009898), MA-50 ($0.010709), and MA-200 ($0.017729) levels, signaling persistent seller pressure in the short, medium, and long term. The nearest dynamic resistance is the Ichimoku Kijun at $0.010075, while support is undefined below the current price, highlighting a lack of immediate downside barriers.
Highlights
- VET trades at $0.007861, significantly below its MA-20 ($0.009898), MA-50 ($0.010709), and MA-200 ($0.017729), indicating sustained bearish pressure across all timeframes.
- Momentum indicators, including MACD, ADX, RSI (30.4), Stochastic RSI, and CCI, all signal an oversold and strongly bearish environment with no current sign of reversal.
- Immediate support is undefined below current price, with a risk of deepening declines if $0.00710 fails; resistance stands at $0.00865 and Ichimoku Kijun at $0.010075.
Oversold conditions deepen as technicals confirm persistent bearish momentum
Momentum on the daily timeframe remains strongly negative, with both MACD and ADX confirming a sustained bearish trend. Indicators such as the RSI (30.4), Stochastic RSI, and CCI all hover around or below their oversold thresholds, indicating that the asset is technically oversold, while Bull/Bear Power points to clear seller dominance intraday. The Awesome Oscillator also aligns with the downward momentum. Today, VET opened slightly lower than the previous close, with no significant gap, and has declined 7.41%, finishing near today’s low within a relatively high volatility session. The tone remains under pressure after the open, as the price stayed near session lows and none of the momentum indicators show bullish reversal signals, reinforcing the intraday bearish bias.
Downside risk heightened as volatility shapes five-day scenario
For the next 5 trading days, the expected price range is adjusted to $0.00710 – $0.00865 to encapsulate typical volatility relative to current levels. The probability of further price decline is very high (more than 80%), while a recovery is less likely. Baseline scenario: VET consolidates in a sideways band between immediate support and the $0.00865 zone. Bullish scenario: a break above $0.00865 could target the Ichimoku Kijun as resistance. Bearish scenario: loss of $0.00710 support would expose the market to deeper declines, driven by sustained bearish momentum on both daily and weekly charts.
Previously it was reported that VeChain remains under persistent seller pressure, trading below key moving averages with negative daily momentum indicators such as MACD and ADX, while oversold readings from RSI, Stochastic RSI, and CCI clash with a sharp intraday rebound. Although technicals suggest oversold conditions and some intraday buying interest, the prevailing bearish trend and strong resistance at the Ichimoku Kijun point toward likely sideways consolidation with downside risk unless a clear breakout above resistance occurs.


Latest VeChain News


-
 Afghanistan
-
 Albania
-
 Algeria
-
 Angola
-
 Argentina
-
 Armenia
-
 Australia
-
 Austria
-
 Azerbaijan
-
 Bahamas
-
 Bahrain
-
 Bangladesh
-
 Belarus
-
 Belgium
-
 Bolivia
-
 Botswana
-
 Brazil
-
 Brunei
-
 Bulgaria
-
 Cambodia
-
 Cameroon
-
 Canada
-
 Chile
Chile
-
 China
China
-
 Colombia
-
 Congo
Congo
-
 Costa Rica
-
 Cote d'Ivoire
-
 Croatia
-
 Cuba
Cuba
-
 Cyprus
-
 Czechia
-
 DR Congo
-
 Denmark
-
 Dominican Republic
-
 Ecuador
-
 Egypt
Egypt
-
 El Salvador
-
 Estonia
-
 Eswatini
-
 Ethiopia
-
 Finland
-
 France
-
 Georgia
-
 Germany
-
 Ghana
Ghana
-
 Greece
-
 Haiti
Haiti
-
 Hong Kong
-
 Hungary
-
 India
India
-
 Indonesia
-
 Iran, Islamic republic
-
 Iraq
Iraq
-
 Ireland
-
 Israel
-
 Italy
Italy
-
 Jamaica
-
 Japan
Japan
-
 Jordan
-
 Kazakhstan
-
 Kenya
Kenya
-
 Korea
Korea
-
 Kuwait
-
 Kyrgyzstan
-
 Laos
Laos
-
 Latvia
-
 Lebanon
-
 Lesotho
-
 Libya
Libya
-
 Lithuania
-
 Luxembourg
-
 Madagascar
-
 Malaysia
-
 Malta
Malta
-
 Mauritius
-
 Mexico
-
 Moldova
-
 Mongolia
-
 Montenegro
-
 Morocco
-
 Mozambique
-
 Myanmar
-
 Namibia
-
 Nepal
Nepal
-
 Netherlands
-
 New Zealand
-
 Nigeria
-
 North Macedonia
-
 Norway
-
 Oman
Oman
-
 Pakistan
-
 Palestine
-
 Panama
-
 Papua New Guinea
-
 Paraguay
-
 Peru
Peru
-
 Philippines
-
 Poland
-
 Portugal
-
 Puerto Rico
-
 Qatar
Qatar
-
 Reunion
-
 Romania
-
 Rwanda
-
 Saudi Arabia
-
 Serbia
-
 Singapore
-
 Slovakia
-
 Slovenia
-
 Somalia
-
 South Africa
-
 Spain
Spain
-
 Sri Lanka
-
 Sweden
-
 Switzerland
-
 Syria
Syria
-
 Taiwan
-
 Tajikistan
-
 Tanzania
-
 Thailand
-
 Trinidad and Tobago
-
 Tunisia
-
 Turkey
-
 UAE
UAE
-
 Uganda
-
 Ukraine
-
 United Kingdom
-
United States
-
 Uruguay
-
 Uzbekistan
-
 Venezuela
-
 Vietnam
-
 Yemen
Yemen
-
 Zambia
-
 Zimbabwe
- Forex
- Crypto
