
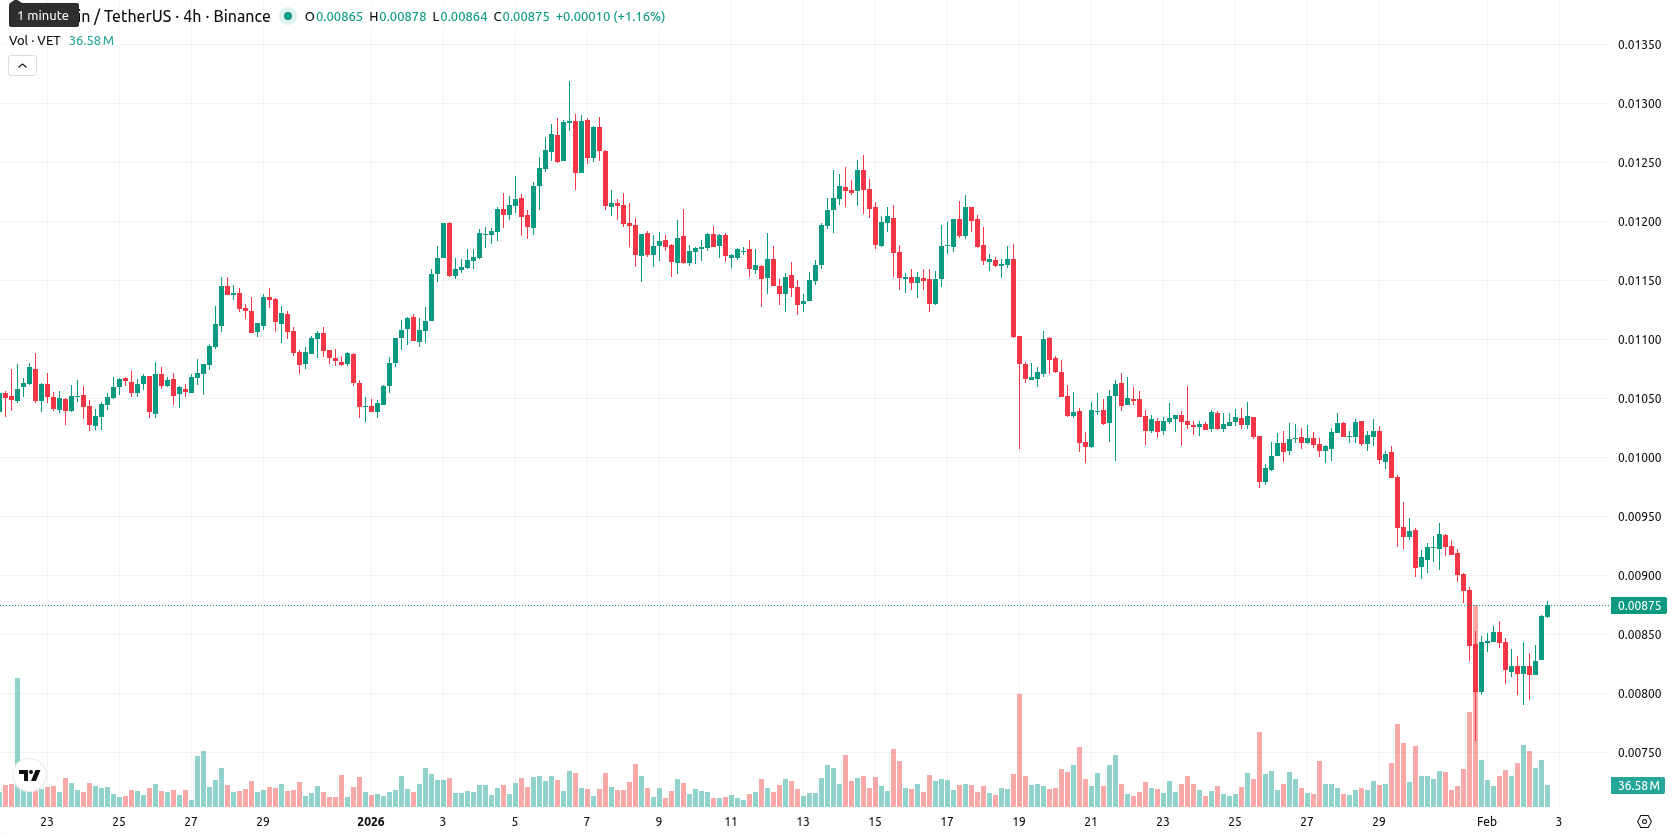
Intraday rally defies bearish momentum — VeChain gains 7.00%

VeChain (VET) is trading at $0.008753, notably below its MA-20 ($0.010418), MA-50 ($0.010856), and MA-200 ($0.018008) levels, indicating continued seller pressure across short-, medium-, and long-term trends. The nearest dynamic resistance is the Ichimoku Kijun at $0.010235, which remains well above the current price, while no significant crossovers between the MA-50 and MA-200 are present.
Highlights
- VeChain (VET) is trading at $0.008753, well below its MA-20 ($0.010418), MA-50 ($0.010856), and MA-200 ($0.018008), confirming bearish pressure across all timeframes.
- Oscillators (RSI, Stochastic RSI, CCI) are signaling oversold conditions while MACD and ADX reaffirm strong bearish momentum, with sellers maintaining control despite intraday rallies.
- Expected trading range for the next 5 days is $0.00810–$0.00970; a breakout above $0.01024 signals short-term bullish reversal, while a drop below $0.00810 continues the downtrend.
Oversold technical signals clash with sharp intraday rebound
Momentum on the daily timeframe is negative, as both MACD and ADX indicate a persistent bearish trend. RSI, Stochastic RSI, and CCI signal oversold conditions, typically suggesting that the market is stretched on the downside though sellers remain dominant per the Bearish Bull/Bear Power reading. Despite today’s upward move of 7%, there was no meaningful gap between the previous close and today’s open, and the price is now near the top of its daily range, reflecting high intraday volatility and strong buying demand toward the session highs. This rally contrasts with dominant bearish momentum and oversold technicals, highlighting a divergence between intraday recovery and broader downside risks.
Sideways trade likely as oversold conflicts with bearish momentum
Looking ahead, the expected price range for the next 5 trading days is $0.00810 – $0.00970, keeping volatility within a typical band relative to current levels. There is a very low probability (less than 20%) of a significant price increase, making a further decline more likely in the short term. The baseline scenario is sideways movement between support and resistance as oversold signals meet persistent selling momentum; a bullish scenario would see VET break above the $0.01024 resistance (Ichimoku Kijun), while a bearish scenario could unfold if the price collapses beneath $0.00810, extending the downtrend.
Last time, analysts noted that VeChain continues to face strong selling pressure, trading well below its major moving averages with weekly technical indicators—such as RSI, MACD, and ADX—signaling sustained bearish momentum despite oversold readings. Immediate consolidation within the $0.00800–$0.00890 range is likely, with downside risks prevailing and any significant rebound seen as improbable unless the asset decisively clears dynamic resistance near the Ichimoku Kijun.


Latest VeChain News


-
 Afghanistan
-
 Albania
-
 Algeria
-
 Angola
-
 Argentina
-
 Armenia
-
 Australia
-
 Austria
-
 Azerbaijan
-
 Bahamas
-
 Bahrain
-
 Bangladesh
-
 Belarus
-
 Belgium
-
 Bolivia
-
 Botswana
-
 Brazil
-
 Brunei
-
 Bulgaria
-
 Cambodia
-
 Cameroon
-
 Canada
-
 Chile
Chile
-
 China
China
-
 Colombia
-
 Congo
Congo
-
 Costa Rica
-
 Cote d'Ivoire
-
 Croatia
-
 Cuba
Cuba
-
 Cyprus
-
 Czechia
-
 DR Congo
-
 Denmark
-
 Dominican Republic
-
 Ecuador
-
 Egypt
Egypt
-
 El Salvador
-
 Estonia
-
 Eswatini
-
 Ethiopia
-
 Finland
-
 France
-
 Georgia
-
 Germany
-
 Ghana
Ghana
-
 Greece
-
 Haiti
Haiti
-
 Hong Kong
-
 Hungary
-
 India
India
-
 Indonesia
-
 Iran, Islamic republic
-
 Iraq
Iraq
-
 Ireland
-
 Israel
-
 Italy
Italy
-
 Jamaica
-
 Japan
Japan
-
 Jordan
-
 Kazakhstan
-
 Kenya
Kenya
-
 Korea
Korea
-
 Kuwait
-
 Kyrgyzstan
-
 Laos
Laos
-
 Latvia
-
 Lebanon
-
 Lesotho
-
 Libya
Libya
-
 Lithuania
-
 Luxembourg
-
 Madagascar
-
 Malaysia
-
 Malta
Malta
-
 Mauritius
-
 Mexico
-
 Moldova
-
 Mongolia
-
 Montenegro
-
 Morocco
-
 Mozambique
-
 Myanmar
-
 Namibia
-
 Nepal
Nepal
-
 Netherlands
-
 New Zealand
-
 Nigeria
-
 North Macedonia
-
 Norway
-
 Oman
Oman
-
 Pakistan
-
 Palestine
-
 Panama
-
 Papua New Guinea
-
 Paraguay
-
 Peru
Peru
-
 Philippines
-
 Poland
-
 Portugal
-
 Puerto Rico
-
 Qatar
Qatar
-
 Reunion
-
 Romania
-
 Rwanda
-
 Saudi Arabia
-
 Serbia
-
 Singapore
-
 Slovakia
-
 Slovenia
-
 Somalia
-
 South Africa
-
 Spain
Spain
-
 Sri Lanka
-
 Sweden
-
 Switzerland
-
 Syria
Syria
-
 Taiwan
-
 Tajikistan
-
 Tanzania
-
 Thailand
-
 Trinidad and Tobago
-
 Tunisia
-
 Turkey
-
 UAE
UAE
-
 Uganda
-
 Ukraine
-
 United Kingdom
-
United States
-
 Uruguay
-
 Uzbekistan
-
 Venezuela
-
 Vietnam
-
 Yemen
Yemen
-
 Zambia
-
 Zimbabwe
- Forex
- Crypto
