
Bonk slips 7.05% as moving averages and momentum indicators reinforce seller control

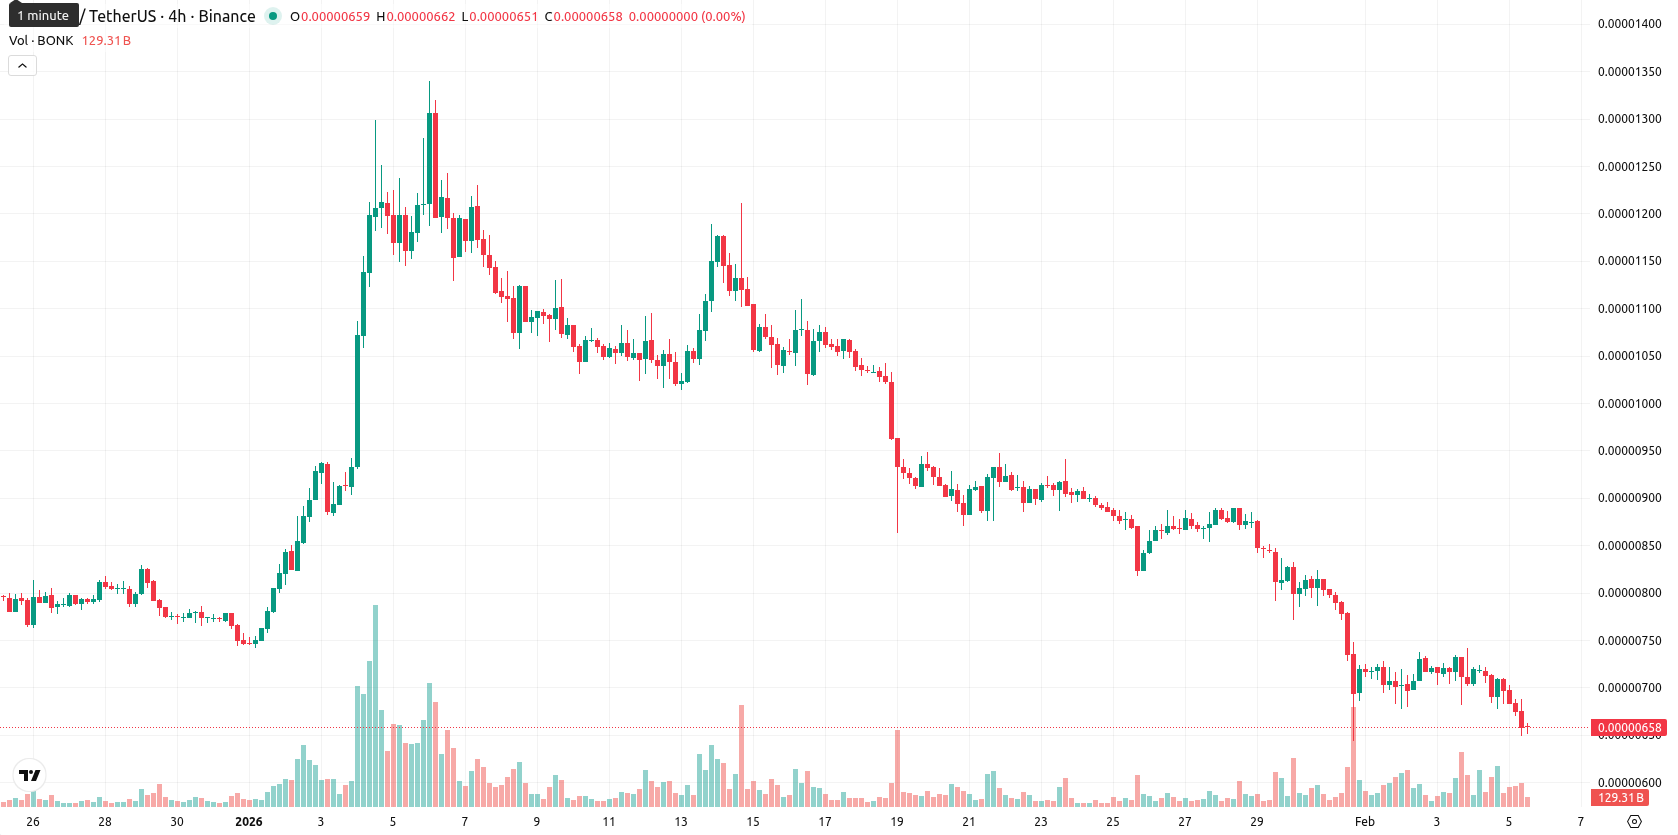
Bonk (BONK) is trading at $0.0000066, down 7.05% from the previous close, and remains below its MA-20 ($0.00000857), MA-50 ($0.00000901), and MA-200 ($0.00001612) levels, highlighting strong bearish sentiment across all timeframes. The price is well under all major moving averages, signaling continued pressure from sellers.
Highlights
- BONK is trading at $0.0000066, below MA-20, MA-50, and MA-200, signaling persistent bearish pressure across all major timeframes.
- Momentum indicators (MACD, ADX) confirm a strong downward bias, with RSI and Stochastic RSI in oversold territory, indicating limited buyer interest but possible mean reversion attempts.
- A consolidation range of $0.0000064–$0.0000073 is projected for the next five sessions, with less than 20% probability for a sustained upside move.
Persistent downside momentum as indicators show deep oversold signals
Momentum indicators on the daily chart reinforce a bearish outlook, with both the MACD and ADX signaling continued downward momentum. The Relative Strength Index, Stochastic RSI, and Commodity Channel Index are all in oversold territory, pointing to limited buying interest but a possible short-term mean reversion. Bull/Bear Power readings confirm seller dominance in intraday trading, and the Awesome Oscillator is negative, consistent with the prevailing downside trend. BONK remains below the Ichimoku Kijun at $0.00000927, which acts as the nearest dynamic resistance, while there is no clear immediate technical support beneath the current level.
Range-bound trading likely as breakout prospects remain subdued
Over the next five trading days, BONK is likely to remain in a typical volatility band between $0.0000064 and $0.0000073, reflecting swings of about ±10% from the current price. The probability of a decisive price breakout to the upside is low, with further declines favored if downward pressure persists. Base case expectations are for consolidation within this narrow range, with a bullish reversal requiring a sustained move above $0.00000927, while a drop below $0.0000064 would open the way to new lows.
Previously it was reported that Bonk is trading under significant bearish pressure, sitting below all major moving averages and showing negative momentum across MACD, ADX, RSI, and other key indicators. Unless the price closes above key resistance near the Ichimoku Kijun, further declines or range-bound trading within a narrow band are expected, with sellers maintaining firm control.


-
 Afghanistan
-
 Albania
-
 Algeria
-
 Angola
-
 Argentina
-
 Armenia
-
 Australia
-
 Austria
-
 Azerbaijan
-
 Bahamas
-
 Bahrain
-
 Bangladesh
-
 Belarus
-
 Belgium
-
 Bolivia
-
 Botswana
-
 Brazil
-
 Brunei
-
 Bulgaria
-
 Cambodia
-
 Cameroon
-
 Canada
-
 Chile
Chile
-
 China
China
-
 Colombia
-
 Congo
Congo
-
 Costa Rica
-
 Cote d'Ivoire
-
 Croatia
-
 Cuba
Cuba
-
 Cyprus
-
 Czechia
-
 DR Congo
-
 Denmark
-
 Dominican Republic
-
 Ecuador
-
 Egypt
Egypt
-
 El Salvador
-
 Estonia
-
 Eswatini
-
 Ethiopia
-
 Finland
-
 France
-
 Georgia
-
 Germany
-
 Ghana
Ghana
-
 Greece
-
 Haiti
Haiti
-
 Hong Kong
-
 Hungary
-
 India
India
-
 Indonesia
-
 Iran, Islamic republic
-
 Iraq
Iraq
-
 Ireland
-
 Israel
-
 Italy
Italy
-
 Jamaica
-
 Japan
Japan
-
 Jordan
-
 Kazakhstan
-
 Kenya
Kenya
-
 Korea
Korea
-
 Kuwait
-
 Kyrgyzstan
-
 Laos
Laos
-
 Latvia
-
 Lebanon
-
 Lesotho
-
 Libya
Libya
-
 Lithuania
-
 Luxembourg
-
 Madagascar
-
 Malaysia
-
 Malta
Malta
-
 Mauritius
-
 Mexico
-
 Moldova
-
 Mongolia
-
 Montenegro
-
 Morocco
-
 Mozambique
-
 Myanmar
-
 Namibia
-
 Nepal
Nepal
-
 Netherlands
-
 New Zealand
-
 Nigeria
-
 North Macedonia
-
 Norway
-
 Oman
Oman
-
 Pakistan
-
 Palestine
-
 Panama
-
 Papua New Guinea
-
 Paraguay
-
 Peru
Peru
-
 Philippines
-
 Poland
-
 Portugal
-
 Puerto Rico
-
 Qatar
Qatar
-
 Reunion
-
 Romania
-
 Rwanda
-
 Saudi Arabia
-
 Serbia
-
 Singapore
-
 Slovakia
-
 Slovenia
-
 Somalia
-
 South Africa
-
 Spain
Spain
-
 Sri Lanka
-
 Sweden
-
 Switzerland
-
 Syria
Syria
-
 Taiwan
-
 Tajikistan
-
 Tanzania
-
 Thailand
-
 Trinidad and Tobago
-
 Tunisia
-
 Turkey
-
 UAE
UAE
-
 Uganda
-
 Ukraine
-
 United Kingdom
-
United States
-
 Uruguay
-
 Uzbekistan
-
 Venezuela
-
 Vietnam
-
 Yemen
Yemen
-
 Zambia
-
 Zimbabwe
- Forex
- Crypto
