
Nexo price prediction: Downtrend persists despite rally? NEXO gains 7.10%

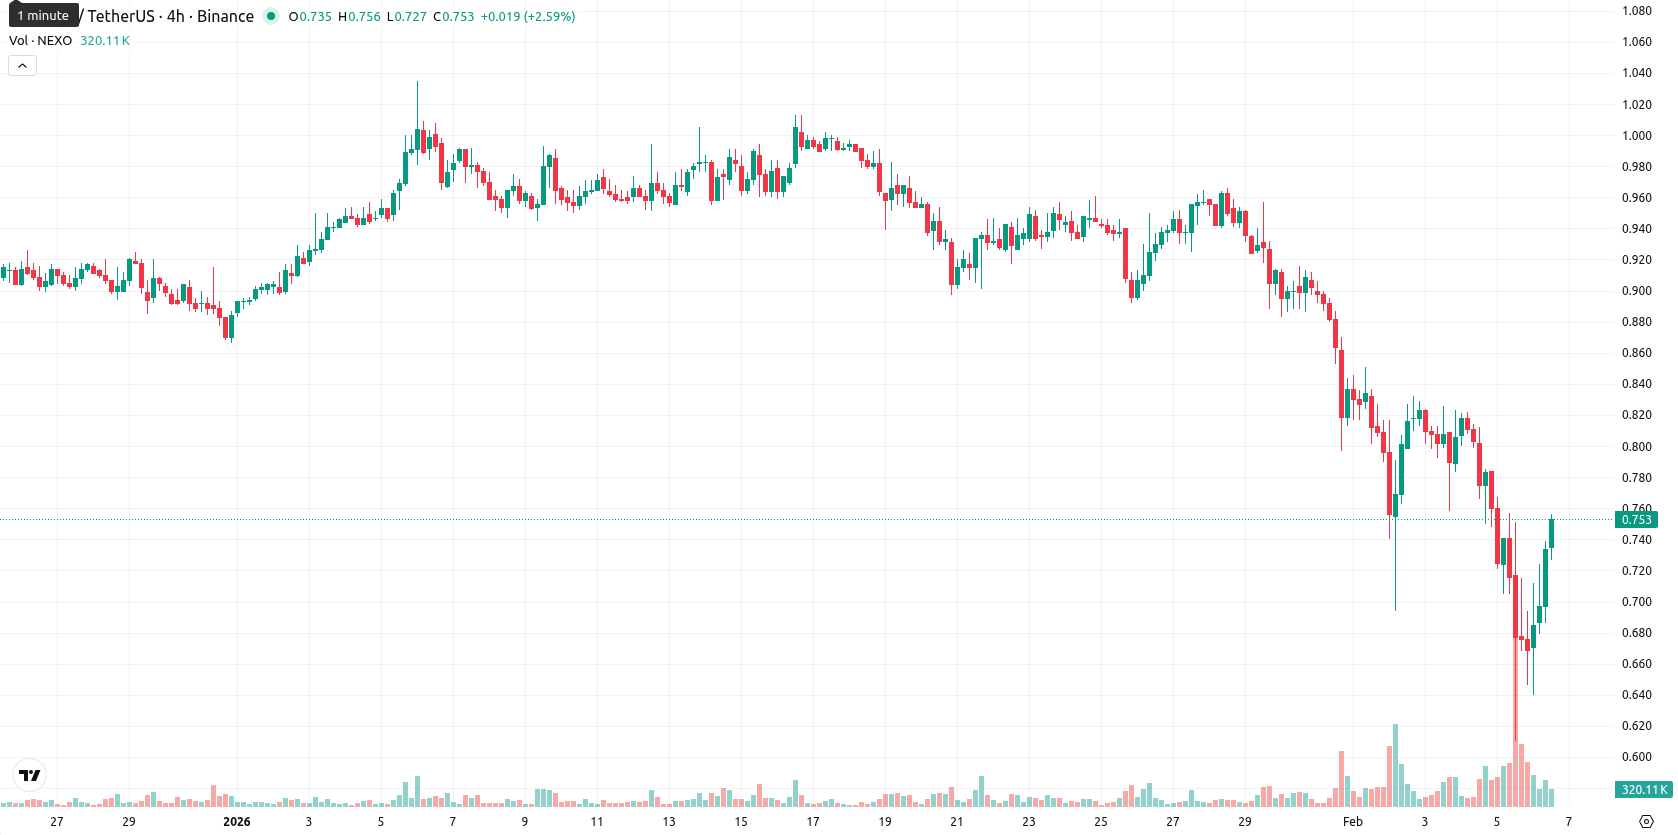
Nexo (NEXO) is trading at $0.754, up 7.10% from the previous close and nearing the intraday high of the $0.64 – $0.749 range. The asset remains below the MA-20 ($0.8916), MA-50 ($0.9199), and MA-200 ($1.1150), signaling ongoing downside pressure in the short, medium, and long-term.
Highlights
- Nexo's platform saw an 83% contraction in total credit, driven by a marked reduction in crypto market risk appetite and unwinding of speculative positions.
- Retail credit withdrawals on Nexo reached $136.63 million in January 2025, indicating persistent credit outflows despite stabilization in credit flows.
- NEXO trades at $0.754, below all major moving averages, with resistance at $0.78 and downside risk if price slips under $0.73.
Credit withdrawals accelerate as risk appetite contracts platform-wide
Recent reports show a sharp contraction of credit activity on the Nexo platform, with an 83% decrease in total credit reflecting a notable reduction in risk appetite across the crypto market. In January 2025, retail credit withdrawals on Nexo reached $136.63 million as credit flows stabilized, yet the platform experienced continued credit outflows. This contraction was observed alongside reductions on other lending platforms as speculative positions unwound and liquidity reset across the ecosystem.
Bearish momentum reinforced as oversold signals clash with volatility
NEXO is below the MA-20, MA-50, and MA-200, indicating sustained bearish momentum across all major Moving Averages. The Ichimoku Kijun at $0.8115 represents the nearest dynamic resistance, with no major support from Ichimoku levels until prior local lows. Momentum indicators remain bearish: the MACD is negative, the ADX points to a moderately strong downtrend, and the Awesome Oscillator is also negative. RSI, CCI, and Stochastic RSI all show deeply oversold conditions on daily and weekly frames, though short-term readings are slightly overbought. Bull/Bear Power continues to show seller dominance intraday, while volatility is elevated. Despite a rebound from intraday lows, oscillators provide a mixed picture with oversold conditions resisting the ongoing bearish trend.
Downside risk elevated as oversold conditions curb selling momentum
For the next five trading days, the expected price range for NEXO is $0.73 – $0.78, reflecting a typical volatility band relative to current levels. There is a low probability (less than 20%) of a price increase, favoring the risk of further downside. The base case sees NEXO moving sideways within this corridor as oversold signals limit additional selling in the near term. A move above $0.78 would trigger a short-covering rally, while a slip below $0.73 may reestablish the broader downtrend if seller pressure intensifies.
Previously it was reported that Nexo is experiencing broad technical weakness, trading well below its main moving averages with persistent bearish signals across momentum indicators such as the RSI MACD and ADX. The asset faces immediate resistance at the Ichimoku Kijun, lacks meaningful support above current levels, and remains under pressure as downside risk outweighs the likelihood of a reversal.


Latest Nexo News


-
 Afghanistan
-
 Albania
-
 Algeria
-
 Angola
-
 Argentina
-
 Armenia
-
 Australia
-
 Austria
-
 Azerbaijan
-
 Bahamas
-
 Bahrain
-
 Bangladesh
-
 Belarus
-
 Belgium
-
 Bolivia
-
 Botswana
-
 Brazil
-
 Brunei
-
 Bulgaria
-
 Cambodia
-
 Cameroon
-
 Canada
-
 Chile
Chile
-
 China
China
-
 Colombia
-
 Congo
Congo
-
 Costa Rica
-
 Cote d'Ivoire
-
 Croatia
-
 Cuba
Cuba
-
 Cyprus
-
 Czechia
-
 DR Congo
-
 Denmark
-
 Dominican Republic
-
 Ecuador
-
 Egypt
Egypt
-
 El Salvador
-
 Estonia
-
 Eswatini
-
 Ethiopia
-
 Finland
-
 France
-
 Georgia
-
 Germany
-
 Ghana
Ghana
-
 Greece
-
 Haiti
Haiti
-
 Hong Kong
-
 Hungary
-
 India
India
-
 Indonesia
-
 Iran, Islamic republic
-
 Iraq
Iraq
-
 Ireland
-
 Israel
-
 Italy
Italy
-
 Jamaica
-
 Japan
Japan
-
 Jordan
-
 Kazakhstan
-
 Kenya
Kenya
-
 Korea
Korea
-
 Kuwait
-
 Kyrgyzstan
-
 Laos
Laos
-
 Latvia
-
 Lebanon
-
 Lesotho
-
 Libya
Libya
-
 Lithuania
-
 Luxembourg
-
 Madagascar
-
 Malaysia
-
 Malta
Malta
-
 Mauritius
-
 Mexico
-
 Moldova
-
 Mongolia
-
 Montenegro
-
 Morocco
-
 Mozambique
-
 Myanmar
-
 Namibia
-
 Nepal
Nepal
-
 Netherlands
-
 New Zealand
-
 Nigeria
-
 North Macedonia
-
 Norway
-
 Oman
Oman
-
 Pakistan
-
 Palestine
-
 Panama
-
 Papua New Guinea
-
 Paraguay
-
 Peru
Peru
-
 Philippines
-
 Poland
-
 Portugal
-
 Puerto Rico
-
 Qatar
Qatar
-
 Reunion
-
 Romania
-
 Rwanda
-
 Saudi Arabia
-
 Serbia
-
 Singapore
-
 Slovakia
-
 Slovenia
-
 Somalia
-
 South Africa
-
 Spain
Spain
-
 Sri Lanka
-
 Sweden
-
 Switzerland
-
 Syria
Syria
-
 Taiwan
-
 Tajikistan
-
 Tanzania
-
 Thailand
-
 Trinidad and Tobago
-
 Tunisia
-
 Turkey
-
 UAE
UAE
-
 Uganda
-
 Ukraine
-
 United Kingdom
-
United States
-
 Uruguay
-
 Uzbekistan
-
 Venezuela
-
 Vietnam
-
 Yemen
Yemen
-
 Zambia
-
 Zimbabwe
- Forex
- Crypto
