
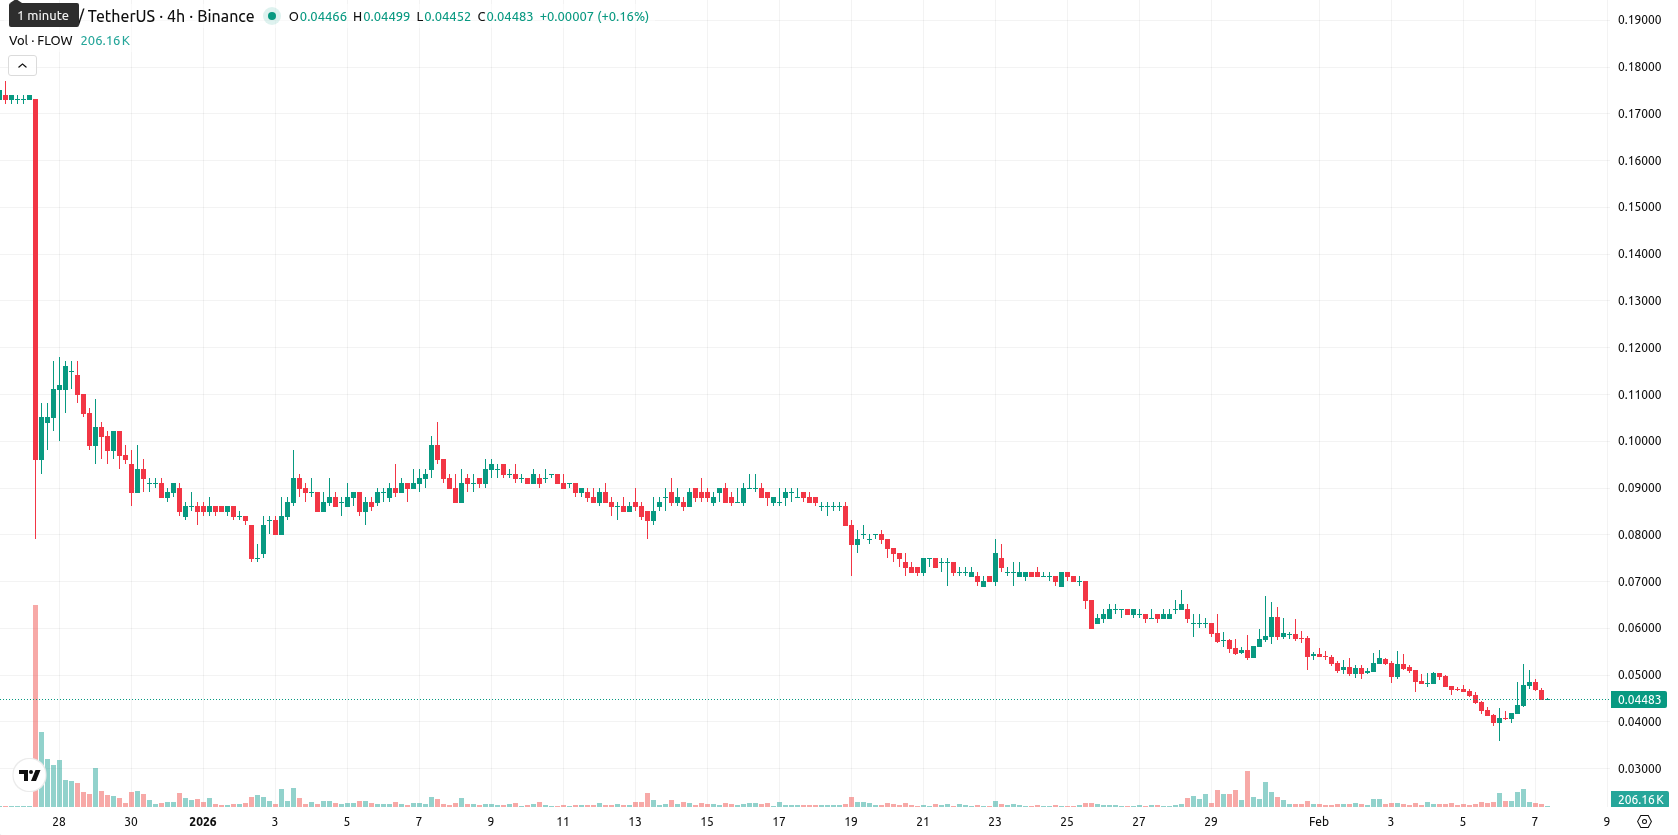
Flow rises 9.31% as technical analysis signals short-term volatility in a narrow range

Flow (FLOW) is trading at $0.0446 after a 9.31% daily rise, remaining well below the MA-20 ($0.0612), MA-50 ($0.0917), and MA-200 ($0.2650), which underscores continued short-, medium-, and long-term selling pressure. The price currently hovers near the low end of today’s volatile range following an intraday reversal and an earlier small upward gap at the open.
Highlights
- FLOW trades at $0.0446, significantly below the MA-20 ($0.0612), MA-50 ($0.0917), and MA-200 ($0.2650), indicating sustained multi-timeframe bearish pressure.
- Momentum indicators—including MACD, ADX, and Awesome Oscillator—signal persistent seller dominance, while RSI and CCI show oversold conditions amid a sharp 9.31% daily rebound reversed by heavy selling.
- Base case projects consolidation between $0.0400 and $0.0535; a bearish breakdown below $0.0400 is more probable than a sustained move above $0.0645 (Ichimoku Kijun resistance).
Bearish momentum persists as technicals signal oversold weakness
Technical analysis shows the closest dynamic resistance at the Ichimoku Kijun ($0.0645), with no immediate support below current levels. Momentum remains weak overall — the MACD issues a strong sell signal, ADX points to a pronounced seller trend, and Bull/Bear Power stays negative, all confirming persistent intraday bearishness. Both RSI and CCI highlight oversold conditions, while the Stochastic RSI is locally overbought within a stretched downtrend. The Awesome Oscillator also confirms the bearish bias.
Sideways consolidation likely as resistance caps upside
In the short term, FLOW is expected to fluctuate within a $0.0400–$0.0535 range, consistent with typical volatility near current prices. There is less than a 20% probability for a sustained upward move, given strong bearish signals from the weekly Moving Averages and oscillators. The most likely scenario sees FLOW consolidating sideways; a bullish break would require overcoming the Ichimoku Kijun at $0.0645, while a bearish move could test or break below $0.0400 if selling pressure intensifies.
Last time, analysts noted that Flow (FLOW) remains under sustained bearish pressure, trading significantly below all major moving averages with strong downside momentum and high volatility. Oscillator readings highlight mixed signals, as the market is deeply oversold by indicators such as RSI and CCI, yet intraday action shows a sharp upward move clashing with ongoing seller dominance and resistance from key levels like the Ichimoku Kijun.


-
 Afghanistan
-
 Albania
-
 Algeria
-
 Angola
-
 Argentina
-
 Armenia
-
 Australia
-
 Austria
-
 Azerbaijan
-
 Bahamas
-
 Bahrain
-
 Bangladesh
-
 Belarus
-
 Belgium
-
 Bolivia
-
 Botswana
-
 Brazil
-
 Brunei
-
 Bulgaria
-
 Cambodia
-
 Cameroon
-
 Canada
-
 Chile
Chile
-
 China
China
-
 Colombia
-
 Congo
Congo
-
 Costa Rica
-
 Cote d'Ivoire
-
 Croatia
-
 Cuba
Cuba
-
 Cyprus
-
 Czechia
-
 DR Congo
-
 Denmark
-
 Dominican Republic
-
 Ecuador
-
 Egypt
Egypt
-
 El Salvador
-
 Estonia
-
 Eswatini
-
 Ethiopia
-
 Finland
-
 France
-
 Georgia
-
 Germany
-
 Ghana
Ghana
-
 Greece
-
 Haiti
Haiti
-
 Hong Kong
-
 Hungary
-
 India
India
-
 Indonesia
-
 Iran, Islamic republic
-
 Iraq
Iraq
-
 Ireland
-
 Israel
-
 Italy
Italy
-
 Jamaica
-
 Japan
Japan
-
 Jordan
-
 Kazakhstan
-
 Kenya
Kenya
-
 Korea
Korea
-
 Kuwait
-
 Kyrgyzstan
-
 Laos
Laos
-
 Latvia
-
 Lebanon
-
 Lesotho
-
 Libya
Libya
-
 Lithuania
-
 Luxembourg
-
 Madagascar
-
 Malaysia
-
 Malta
Malta
-
 Mauritius
-
 Mexico
-
 Moldova
-
 Mongolia
-
 Montenegro
-
 Morocco
-
 Mozambique
-
 Myanmar
-
 Namibia
-
 Nepal
Nepal
-
 Netherlands
-
 New Zealand
-
 Nigeria
-
 North Macedonia
-
 Norway
-
 Oman
Oman
-
 Pakistan
-
 Palestine
-
 Panama
-
 Papua New Guinea
-
 Paraguay
-
 Peru
Peru
-
 Philippines
-
 Poland
-
 Portugal
-
 Puerto Rico
-
 Qatar
Qatar
-
 Reunion
-
 Romania
-
 Rwanda
-
 Saudi Arabia
-
 Serbia
-
 Singapore
-
 Slovakia
-
 Slovenia
-
 Somalia
-
 South Africa
-
 Spain
Spain
-
 Sri Lanka
-
 Sweden
-
 Switzerland
-
 Syria
Syria
-
 Taiwan
-
 Tajikistan
-
 Tanzania
-
 Thailand
-
 Trinidad and Tobago
-
 Tunisia
-
 Turkey
-
 UAE
UAE
-
 Uganda
-
 Ukraine
-
 United Kingdom
-
United States
-
 Uruguay
-
 Uzbekistan
-
 Venezuela
-
 Vietnam
-
 Yemen
Yemen
-
 Zambia
-
 Zimbabwe
- Forex
- Crypto
