
+7.75% for Cosmos — sellers retain dominance amid mixed oscillator signals

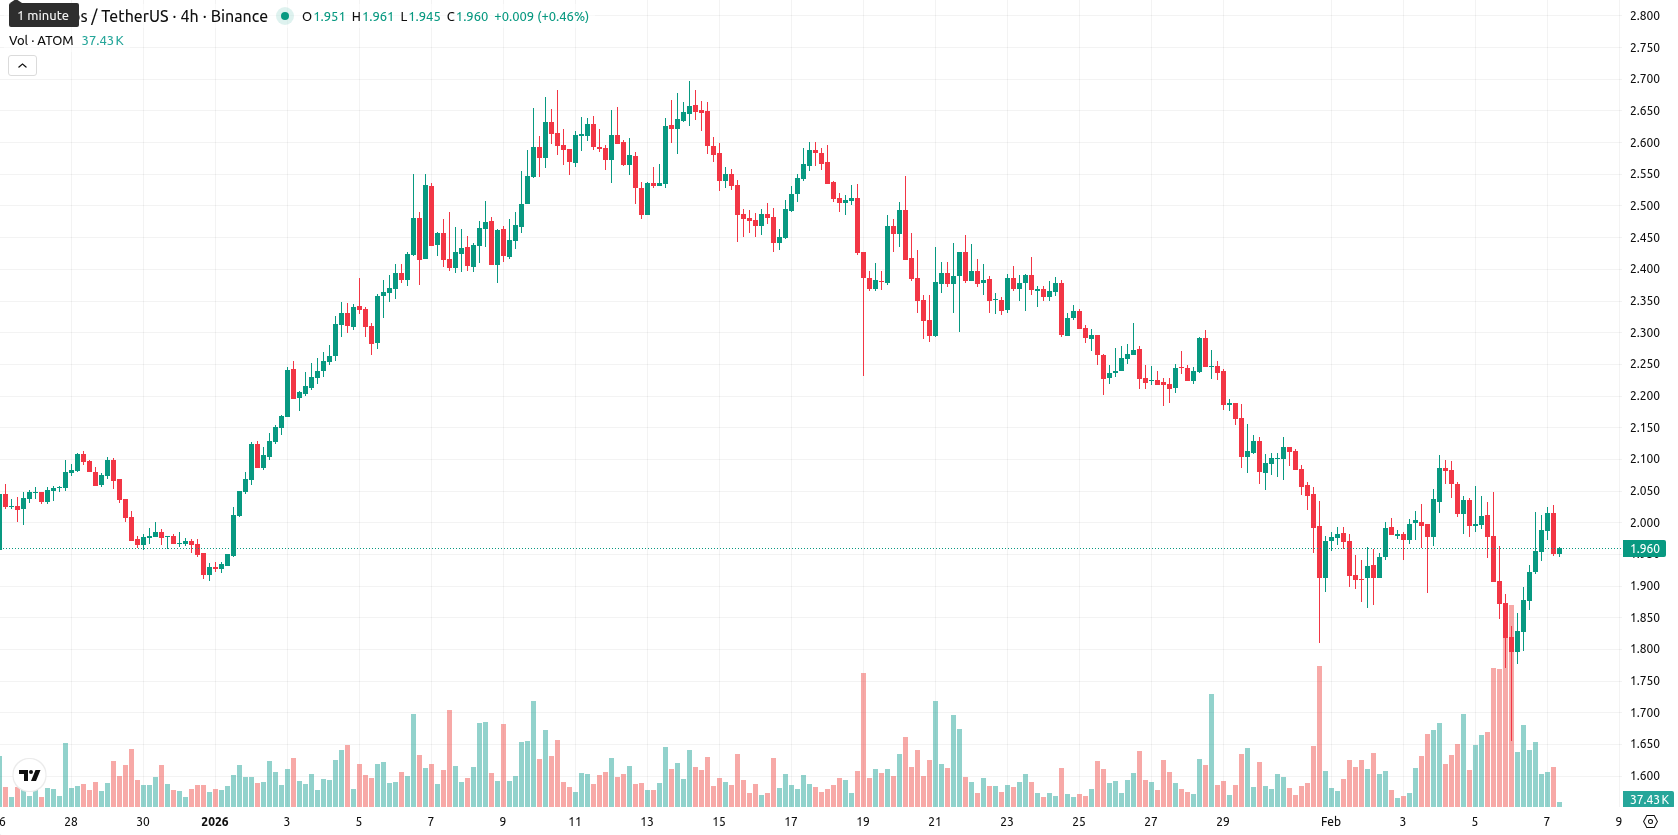
Cosmos (ATOM) is trading at $1.96 after a daily upward move, currently sitting below the MA-20 ($2.1739), MA-50 ($2.2176), and MA-200 ($3.2929), which highlights prevailing short-, medium-, and long-term selling pressure. The price now lies mid-range between $1.947 and $2.028, under its dynamic resistance at the Ichimoku Kijun level of $2.20.
Highlights
- ATOM trades at $1.96, below MA-20 ($2.1739), MA-50 ($2.2176), and MA-200 ($3.2929), signaling sustained bearish pressure across all timeframes.
- Momentum indicators are weak—MACD and ADX show a bearish setup, while oscillators diverge: RSI is bearish, CCI is oversold, but Stochastic RSI signals a strong buy.
- The price is expected to remain range-bound between $1.82 and $2.20 over the next five days, with less than 20% probability of a sustained price increase.
Bearish signals dominate as oscillators diverge and volatility stabilizes
Momentum indicators remain weak, with the MACD and ADX both reflecting a bearish environment. Oscillators give mixed signals: the RSI is in sell territory, the CCI is oversold, and the Stochastic RSI points to a strong buy, indicating technical divergence. Bull/Bear Power is negative, affirming continued seller dominance. Volatility is moderate and early-session strength has yielded to consolidation.
Limited upside seen as range-bound trading and downside risk prevail
Over the next five trading days, Cosmos is expected to remain within a $1.82 – $2.20 volatility band relative to current levels. The probability of a sustained price increase is very low (less than 20%), suggesting that further declines are more likely. Sideways action within this band is the baseline scenario, while a breakout above $2.20 could lead to short covering and a move toward higher resistance. A drop below $1.82 would confirm renewed selling and expose the market to further downside.
Previously it was reported that Cosmos (ATOM) posted a strong daily gain but continues to trade below short-, medium-, and long-term moving averages, signaling sustained seller pressure. Despite deeply oversold conditions indicated by RSI, Stoch RSI, and CCI, and some short-term buy signals emerging, weak overall momentum and pronounced resistance suggest any recovery may be limited while volatility remains elevated.


-
 Afghanistan
-
 Albania
-
 Algeria
-
 Angola
-
 Argentina
-
 Armenia
-
 Australia
-
 Austria
-
 Azerbaijan
-
 Bahamas
-
 Bahrain
-
 Bangladesh
-
 Belarus
-
 Belgium
-
 Bolivia
-
 Botswana
-
 Brazil
-
 Brunei
-
 Bulgaria
-
 Cambodia
-
 Cameroon
-
 Canada
-
 Chile
Chile
-
 China
China
-
 Colombia
-
 Congo
Congo
-
 Costa Rica
-
 Cote d'Ivoire
-
 Croatia
-
 Cuba
Cuba
-
 Cyprus
-
 Czechia
-
 DR Congo
-
 Denmark
-
 Dominican Republic
-
 Ecuador
-
 Egypt
Egypt
-
 El Salvador
-
 Estonia
-
 Eswatini
-
 Ethiopia
-
 Finland
-
 France
-
 Georgia
-
 Germany
-
 Ghana
Ghana
-
 Greece
-
 Haiti
Haiti
-
 Hong Kong
-
 Hungary
-
 India
India
-
 Indonesia
-
 Iran, Islamic republic
-
 Iraq
Iraq
-
 Ireland
-
 Israel
-
 Italy
Italy
-
 Jamaica
-
 Japan
Japan
-
 Jordan
-
 Kazakhstan
-
 Kenya
Kenya
-
 Korea
Korea
-
 Kuwait
-
 Kyrgyzstan
-
 Laos
Laos
-
 Latvia
-
 Lebanon
-
 Lesotho
-
 Libya
Libya
-
 Lithuania
-
 Luxembourg
-
 Madagascar
-
 Malaysia
-
 Malta
Malta
-
 Mauritius
-
 Mexico
-
 Moldova
-
 Mongolia
-
 Montenegro
-
 Morocco
-
 Mozambique
-
 Myanmar
-
 Namibia
-
 Nepal
Nepal
-
 Netherlands
-
 New Zealand
-
 Nigeria
-
 North Macedonia
-
 Norway
-
 Oman
Oman
-
 Pakistan
-
 Palestine
-
 Panama
-
 Papua New Guinea
-
 Paraguay
-
 Peru
Peru
-
 Philippines
-
 Poland
-
 Portugal
-
 Puerto Rico
-
 Qatar
Qatar
-
 Reunion
-
 Romania
-
 Rwanda
-
 Saudi Arabia
-
 Serbia
-
 Singapore
-
 Slovakia
-
 Slovenia
-
 Somalia
-
 South Africa
-
 Spain
Spain
-
 Sri Lanka
-
 Sweden
-
 Switzerland
-
 Syria
Syria
-
 Taiwan
-
 Tajikistan
-
 Tanzania
-
 Thailand
-
 Trinidad and Tobago
-
 Tunisia
-
 Turkey
-
 UAE
UAE
-
 Uganda
-
 Ukraine
-
 United Kingdom
-
United States
-
 Uruguay
-
 Uzbekistan
-
 Venezuela
-
 Vietnam
-
 Yemen
Yemen
-
 Zambia
-
 Zimbabwe
- Forex
- Crypto
