
+7.49% for Nexo — price tests resistance amid prevailing seller dominance

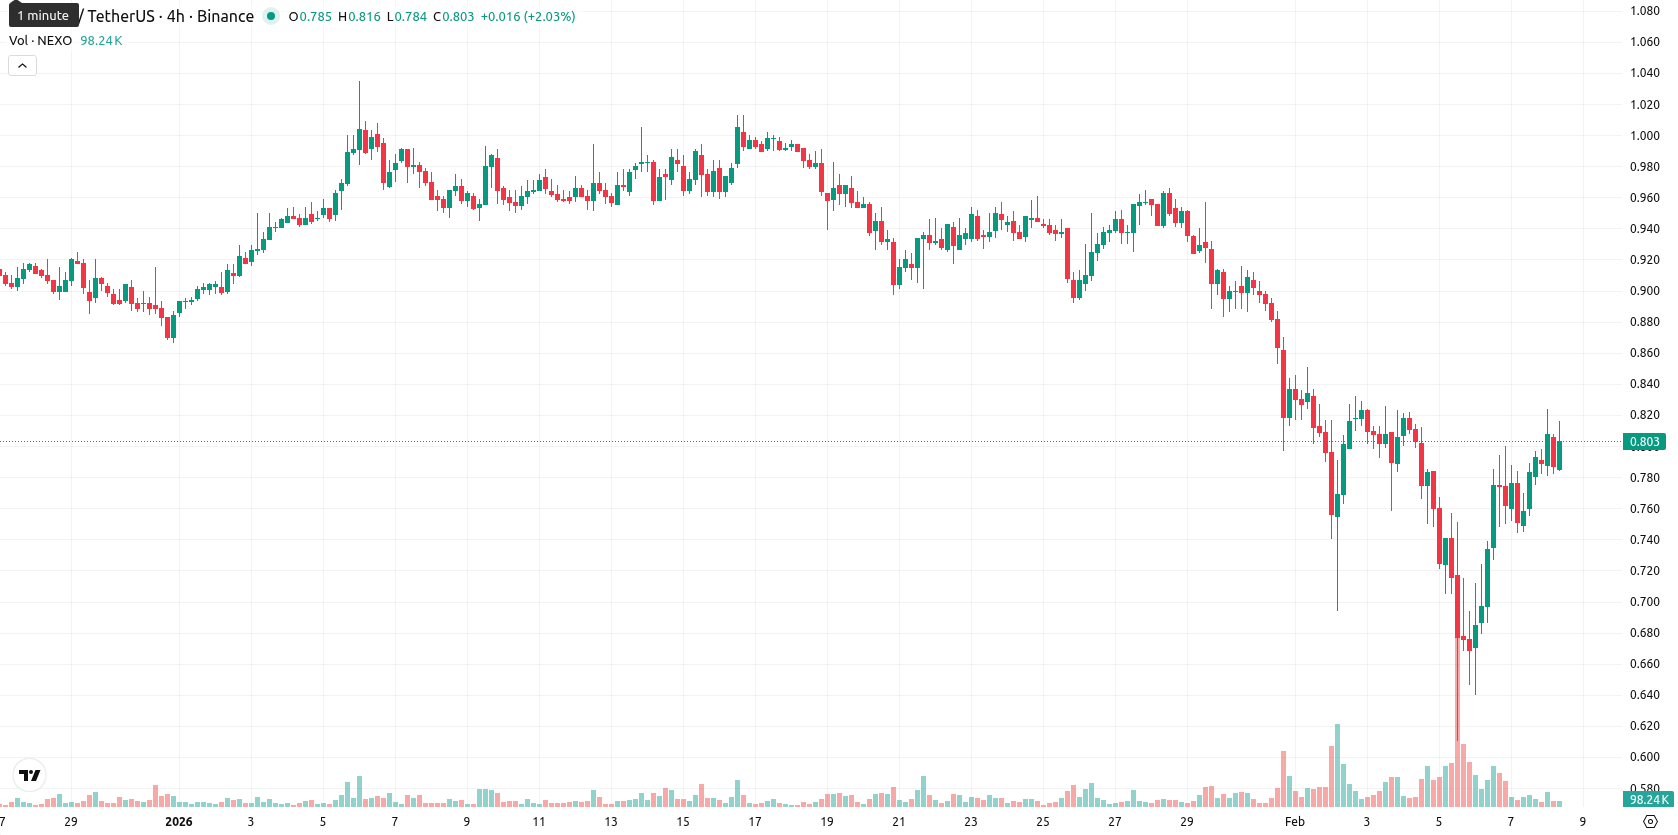
Nexo (NEXO) is trading at $0.804, remaining below the MA-20 ($0.8709), MA-50 ($0.9142), and MA-200 ($1.1094), which reflects sustained downside pressure in short-, medium-, and long-term trends. The token is showing a daily gain of 7.49%, but remains below key moving averages.
Highlights
- NEXO is trading at $0.804, consistently below the MA-20 ($0.8709), MA-50 ($0.9142), and MA-200 ($1.1094), indicating entrenched downside momentum across all timeframes.
- Momentum indicators including MACD, ADX, and Bull/Bear Power signal sustained underlying weakness, while RSI and CCI suggest some stabilization amid prevailing bearish sentiment.
- Trading range for the next five sessions is projected at $0.75–$0.88 with resistance at the Ichimoku Kijun ($0.8115) and dynamic support in the $0.75–$0.78 zone.
Momentum weakens as sellers dominate near key resistance
The nearest dynamic resistance is the Ichimoku Kijun at $0.8115, with dynamic support now likely in the $0.75–$0.78 zone based on recent lows. Momentum outlook is weak overall, as both the MACD and Average Directional Index signal lackluster underlying strength and a prevailing bearish tone. Oversold readings from the Relative Strength Index and Commodity Channel Index suggest some stabilization, though the Stochastic RSI is neutral and does not indicate an imminent reversal. Bull/Bear Power remains slightly negative, with sellers maintaining intraday dominance despite high volatility and the price currently trades near the high of today’s range ($0.781–$0.824), reflecting sustained buying pressure after the open.
Range-bound outlook as upside faces resistance amid low breakout odds
For the next five trading days, the expected volatility band is $0.75–$0.88. There is a very low probability (less than 20%) of a meaningful price increase, while a further decline or sideways movement is far more likely. The baseline scenario assumes NEXO holds between $0.75 and $0.88 amid choppy direction; a bullish case would require a breakout above the Ichimoku Kijun resistance near $0.81, with upside toward the $0.88 zone, while a bearish move below $0.75 could trigger renewed declines toward recent lows.
Previously it was reported that Nexo remains in a bearish trend, trading below all key moving averages with technical indicators such as MACD, ADX, and RSI confirming persistent downside pressure despite a recent upward move. Resistance is established near the Ichimoku Kijun at $0.8115 while support is seen near $0.74, with the probability of a sustained breakout considered very low in the near term.


Latest Nexo News


-
 Afghanistan
-
 Albania
-
 Algeria
-
 Angola
-
 Argentina
-
 Armenia
-
 Australia
-
 Austria
-
 Azerbaijan
-
 Bahamas
-
 Bahrain
-
 Bangladesh
-
 Belarus
-
 Belgium
-
 Bolivia
-
 Botswana
-
 Brazil
-
 Brunei
-
 Bulgaria
-
 Cambodia
-
 Cameroon
-
 Canada
-
 Chile
Chile
-
 China
China
-
 Colombia
-
 Congo
Congo
-
 Costa Rica
-
 Cote d'Ivoire
-
 Croatia
-
 Cuba
Cuba
-
 Cyprus
-
 Czechia
-
 DR Congo
-
 Denmark
-
 Dominican Republic
-
 Ecuador
-
 Egypt
Egypt
-
 El Salvador
-
 Estonia
-
 Eswatini
-
 Ethiopia
-
 Finland
-
 France
-
 Georgia
-
 Germany
-
 Ghana
Ghana
-
 Greece
-
 Haiti
Haiti
-
 Hong Kong
-
 Hungary
-
 India
India
-
 Indonesia
-
 Iran, Islamic republic
-
 Iraq
Iraq
-
 Ireland
-
 Israel
-
 Italy
Italy
-
 Jamaica
-
 Japan
Japan
-
 Jordan
-
 Kazakhstan
-
 Kenya
Kenya
-
 Korea
Korea
-
 Kuwait
-
 Kyrgyzstan
-
 Laos
Laos
-
 Latvia
-
 Lebanon
-
 Lesotho
-
 Libya
Libya
-
 Lithuania
-
 Luxembourg
-
 Madagascar
-
 Malaysia
-
 Malta
Malta
-
 Mauritius
-
 Mexico
-
 Moldova
-
 Mongolia
-
 Montenegro
-
 Morocco
-
 Mozambique
-
 Myanmar
-
 Namibia
-
 Nepal
Nepal
-
 Netherlands
-
 New Zealand
-
 Nigeria
-
 North Macedonia
-
 Norway
-
 Oman
Oman
-
 Pakistan
-
 Palestine
-
 Panama
-
 Papua New Guinea
-
 Paraguay
-
 Peru
Peru
-
 Philippines
-
 Poland
-
 Portugal
-
 Puerto Rico
-
 Qatar
Qatar
-
 Reunion
-
 Romania
-
 Rwanda
-
 Saudi Arabia
-
 Serbia
-
 Singapore
-
 Slovakia
-
 Slovenia
-
 Somalia
-
 South Africa
-
 Spain
Spain
-
 Sri Lanka
-
 Sweden
-
 Switzerland
-
 Syria
Syria
-
 Taiwan
-
 Tajikistan
-
 Tanzania
-
 Thailand
-
 Trinidad and Tobago
-
 Tunisia
-
 Turkey
-
 UAE
UAE
-
 Uganda
-
 Ukraine
-
 United Kingdom
-
United States
-
 Uruguay
-
 Uzbekistan
-
 Venezuela
-
 Vietnam
-
 Yemen
Yemen
-
 Zambia
-
 Zimbabwe
- Forex
- Crypto
