
-7.83% for Flow — price stays under key moving averages amid steady selling

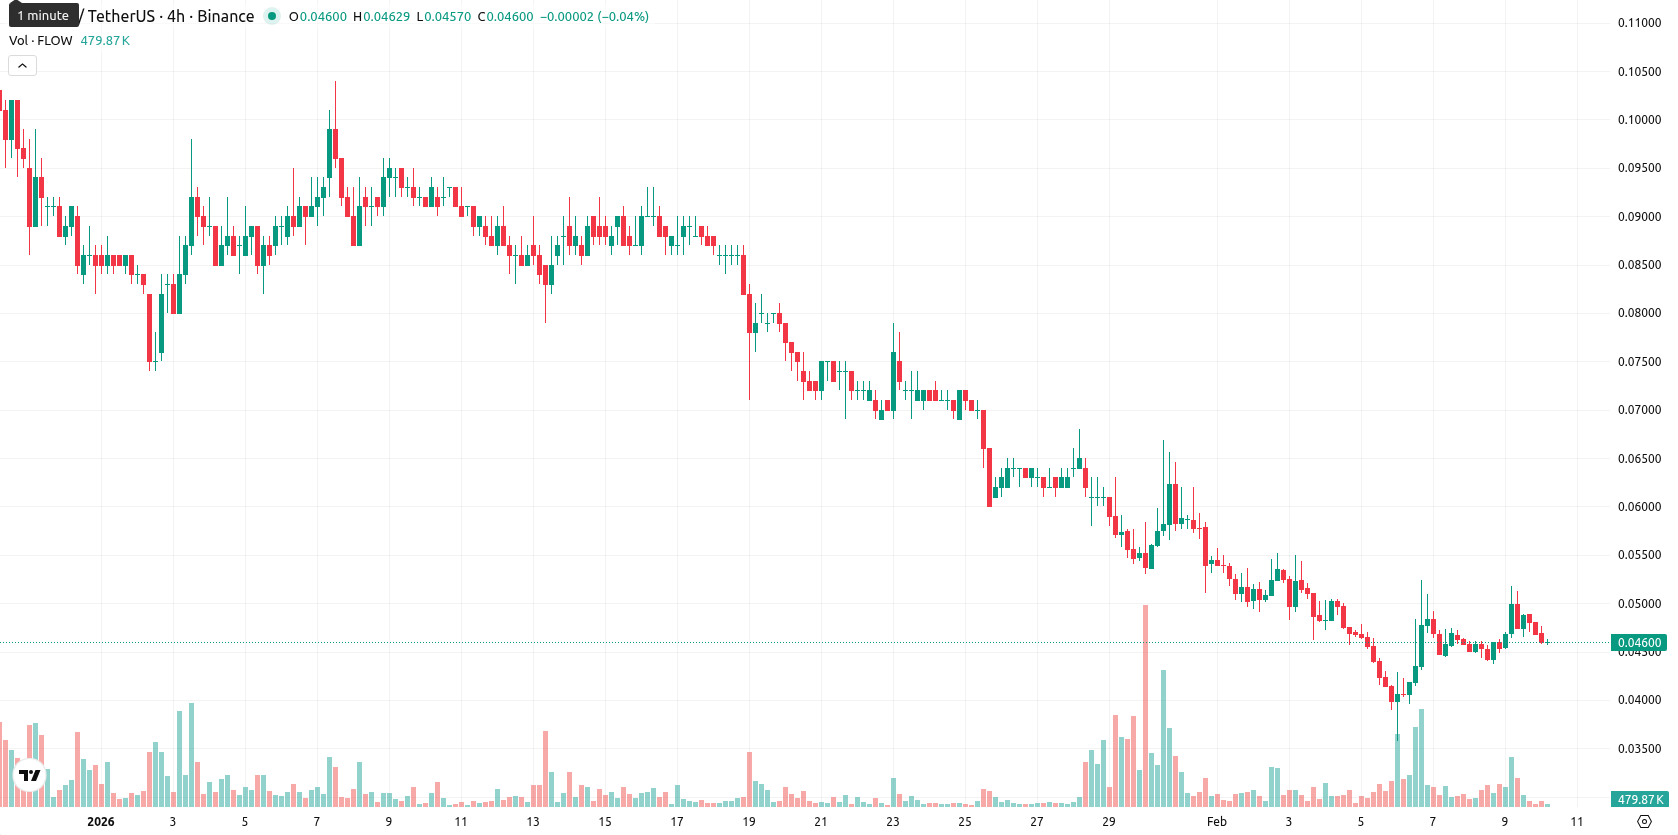
Flow (FLOW) is trading at $0.0459 after slipping 7.83% since the prior session, positioning decisively below its MA-20 ($0.0564), MA-50 ($0.0839), and MA-200 ($0.2594). The asset remains under steady seller pressure, persistently below all key moving averages.
Highlights
- FLOW is trading at $0.0459, significantly below its MA-20 ($0.0564), MA-50 ($0.0839), and MA-200 ($0.2594), signaling persistent multi-timeframe bearishness.
- Momentum indicators including MACD, ADX, and CCI reinforce seller dominance, while dissonance between Stochastic RSI (overbought) and RSI (near oversold) suggests short-term exhaustion amid ongoing downside.
- Critical resistance lies at the Ichimoku Kijun ($0.0645); if FLOW drops below $0.0420, further lows are likely, while any bullish reversal requires a decisive break above resistance.
Bearish momentum persists as technical gauges reinforce downside risks
Technical analysis confirms that FLOW is encountering resistance at the Ichimoku Kijun ($0.0645) with its overall trend remaining bearish, while no golden or death cross signals are present. Momentum gauges reinforce the downside: MACD and ADX tilt strongly bearish, while RSI is just above oversold and Stochastic RSI on D1 is overbought. The CCI remains in the “Sell” zone, reflecting ongoing pressure, although Bull/Bear Power is neutral on the D1 but bearish intraday. The Awesome Oscillator is neutral, signaling a lack of conviction in the current trend.
Downside bias remains as sell signals and volatility constrain upside
For the next five trading days, FLOW is likely to fluctuate within a typical volatility band of $0.0420 – $0.0500 around current levels. Persistent “Sell” signals from W1 RSI, ADX, MACD, and MA-50 suggest upside potential is very low, making further declines more probable. The baseline scenario anticipates sideways movement, while a recovery would require a solid break above the Ichimoku Kijun ($0.0645). If FLOW drops through $0.0420, it could expose the asset to new cycle lows.
Last time, analysts noted that Flow (FLOW) remained firmly below its key moving averages, with persistent bearish momentum confirmed by MACD and ADX and technical oscillators highlighting oversold conditions. Immediate resistance is set near the Ichimoku Kijun at $0.0645, while current momentum indicators signal continued downside pressure amid ongoing volatility and lack of significant dynamic support.


-
 Afghanistan
-
 Albania
-
 Algeria
-
 Angola
-
 Argentina
-
 Armenia
-
 Australia
-
 Austria
-
 Azerbaijan
-
 Bahamas
-
 Bahrain
-
 Bangladesh
-
 Belarus
-
 Belgium
-
 Bolivia
-
 Botswana
-
 Brazil
-
 Brunei
-
 Bulgaria
-
 Cambodia
-
 Cameroon
-
 Canada
-
 Chile
Chile
-
 China
China
-
 Colombia
-
 Congo
Congo
-
 Costa Rica
-
 Cote d'Ivoire
-
 Croatia
-
 Cuba
Cuba
-
 Cyprus
-
 Czechia
-
 DR Congo
-
 Denmark
-
 Dominican Republic
-
 Ecuador
-
 Egypt
Egypt
-
 El Salvador
-
 Estonia
-
 Eswatini
-
 Ethiopia
-
 Finland
-
 France
-
 Georgia
-
 Germany
-
 Ghana
Ghana
-
 Greece
-
 Haiti
Haiti
-
 Hong Kong
-
 Hungary
-
 India
India
-
 Indonesia
-
 Iran, Islamic republic
-
 Iraq
Iraq
-
 Ireland
-
 Israel
-
 Italy
Italy
-
 Jamaica
-
 Japan
Japan
-
 Jordan
-
 Kazakhstan
-
 Kenya
Kenya
-
 Korea
Korea
-
 Kuwait
-
 Kyrgyzstan
-
 Laos
Laos
-
 Latvia
-
 Lebanon
-
 Lesotho
-
 Libya
Libya
-
 Lithuania
-
 Luxembourg
-
 Madagascar
-
 Malaysia
-
 Malta
Malta
-
 Mauritius
-
 Mexico
-
 Moldova
-
 Mongolia
-
 Montenegro
-
 Morocco
-
 Mozambique
-
 Myanmar
-
 Namibia
-
 Nepal
Nepal
-
 Netherlands
-
 New Zealand
-
 Nigeria
-
 North Macedonia
-
 Norway
-
 Oman
Oman
-
 Pakistan
-
 Palestine
-
 Panama
-
 Papua New Guinea
-
 Paraguay
-
 Peru
Peru
-
 Philippines
-
 Poland
-
 Portugal
-
 Puerto Rico
-
 Qatar
Qatar
-
 Reunion
-
 Romania
-
 Rwanda
-
 Saudi Arabia
-
 Serbia
-
 Singapore
-
 Slovakia
-
 Slovenia
-
 Somalia
-
 South Africa
-
 Spain
Spain
-
 Sri Lanka
-
 Sweden
-
 Switzerland
-
 Syria
Syria
-
 Taiwan
-
 Tajikistan
-
 Tanzania
-
 Thailand
-
 Trinidad and Tobago
-
 Tunisia
-
 Turkey
-
 UAE
UAE
-
 Uganda
-
 Ukraine
-
 United Kingdom
-
United States
-
 Uruguay
-
 Uzbekistan
-
 Venezuela
-
 Vietnam
-
 Yemen
Yemen
-
 Zambia
-
 Zimbabwe
- Forex
- Crypto
