
-7.78% for Jupiter — oversold oscillators reinforce downside risk

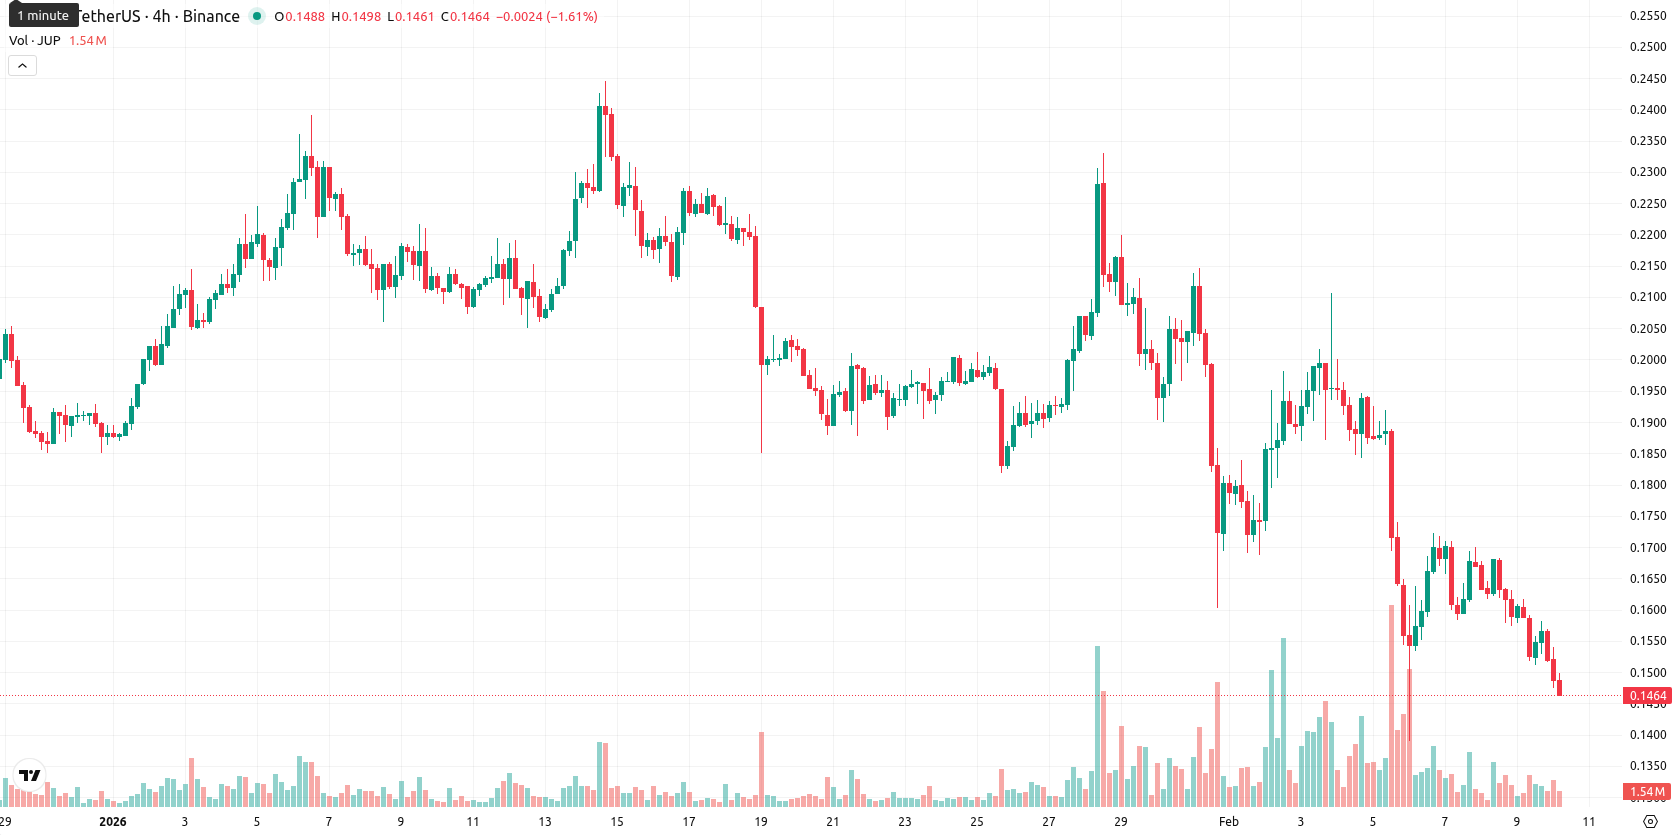
Jupiter (JUP) is currently trading at $0.1469, below the MA-20 ($0.1857), MA-50 ($0.1990), and MA-200 ($0.3500), which signals sustained seller pressure across short, medium, and long-term trends. The nearest significant dynamic resistance is the Ichimoku Kijun level at $0.1860, as the price remains well below this threshold.
Highlights
- Jupiter (JUP) is trading at $0.1469, well below the MA-20 ($0.1857), MA-50 ($0.1990), and MA-200 ($0.3500), reflecting persistent seller pressure across all timeframes.
- Bearish momentum is confirmed by negative MACD, ADX, and a low RSI (36), with CCI and Stochastic RSI indicating pronounced oversold conditions and seller dominance.
- The likely weekly range for JUP is $0.1430–$0.1520, with an 80%+ probability of further declines unless a bullish breakout above $0.1520 materializes.
Oversold signals build as selling momentum persists across timeframes
Momentum readings on the daily timeframe are negative, with the MACD and ADX both indicating persistent bearish momentum and lack of trend strength. Multiple oscillators — including the RSI (36), Stochastic RSI (oversold), and CCI (oversold) — flag pronounced oversold conditions, yet Bull/Bear Power confirms that sellers dominate intraday action. The Awesome Oscillator reinforces the ongoing downtrend, while today's session reflects a drop of 7.78% without any significant gap between the previous close and the open. The price is trading near the session low in a high-volatility environment, reflecting heavy downward pressure from the opening bell and little evidence of intraday recovery; momentum and oscillator signals are aligned to the downside.
Continued downside risk as bearish momentum restricts rebound potential
Looking ahead, the expected weekly range for JUP is $0.1430 to $0.1520, keeping price movement within a typical volatility band relative to current levels. The probability of further price decline in the coming days is very high (more than 80%), with a price rebound being much less likely, as all major weekly momentum and trend indicators remain firmly bearish. The baseline scenario is for continued sideways trading within the adjusted range. A bullish scenario would require a breakout above $0.1520, reducing pressure and potentially retesting resistance, while a bearish outcome could see a close below $0.1430, setting up new lows on persistent seller dominance.
Previously it was reported that Jupiter continues to trade under persistent bearish momentum, remaining well below key moving averages with technical indicators such as MACD RSI and CCI all in oversold territory and confirming sustained downside pressure. Immediate dynamic resistance stands at $0.1918, with no clear major support levels, while volatility is expected to keep prices constrained within a narrow range, limiting rebound prospects in the near term.


Latest Jupiter News


-
 Afghanistan
-
 Albania
-
 Algeria
-
 Angola
-
 Argentina
-
 Armenia
-
 Australia
-
 Austria
-
 Azerbaijan
-
 Bahamas
-
 Bahrain
-
 Bangladesh
-
 Belarus
-
 Belgium
-
 Bolivia
-
 Botswana
-
 Brazil
-
 Brunei
-
 Bulgaria
-
 Cambodia
-
 Cameroon
-
 Canada
-
 Chile
Chile
-
 China
China
-
 Colombia
-
 Congo
Congo
-
 Costa Rica
-
 Cote d'Ivoire
-
 Croatia
-
 Cuba
Cuba
-
 Cyprus
-
 Czechia
-
 DR Congo
-
 Denmark
-
 Dominican Republic
-
 Ecuador
-
 Egypt
Egypt
-
 El Salvador
-
 Estonia
-
 Eswatini
-
 Ethiopia
-
 Finland
-
 France
-
 Georgia
-
 Germany
-
 Ghana
Ghana
-
 Greece
-
 Haiti
Haiti
-
 Hong Kong
-
 Hungary
-
 India
India
-
 Indonesia
-
 Iran, Islamic republic
-
 Iraq
Iraq
-
 Ireland
-
 Israel
-
 Italy
Italy
-
 Jamaica
-
 Japan
Japan
-
 Jordan
-
 Kazakhstan
-
 Kenya
Kenya
-
 Korea
Korea
-
 Kuwait
-
 Kyrgyzstan
-
 Laos
Laos
-
 Latvia
-
 Lebanon
-
 Lesotho
-
 Libya
Libya
-
 Lithuania
-
 Luxembourg
-
 Madagascar
-
 Malaysia
-
 Malta
Malta
-
 Mauritius
-
 Mexico
-
 Moldova
-
 Mongolia
-
 Montenegro
-
 Morocco
-
 Mozambique
-
 Myanmar
-
 Namibia
-
 Nepal
Nepal
-
 Netherlands
-
 New Zealand
-
 Nigeria
-
 North Macedonia
-
 Norway
-
 Oman
Oman
-
 Pakistan
-
 Palestine
-
 Panama
-
 Papua New Guinea
-
 Paraguay
-
 Peru
Peru
-
 Philippines
-
 Poland
-
 Portugal
-
 Puerto Rico
-
 Qatar
Qatar
-
 Reunion
-
 Romania
-
 Rwanda
-
 Saudi Arabia
-
 Serbia
-
 Singapore
-
 Slovakia
-
 Slovenia
-
 Somalia
-
 South Africa
-
 Spain
Spain
-
 Sri Lanka
-
 Sweden
-
 Switzerland
-
 Syria
Syria
-
 Taiwan
-
 Tajikistan
-
 Tanzania
-
 Thailand
-
 Trinidad and Tobago
-
 Tunisia
-
 Turkey
-
 UAE
UAE
-
 Uganda
-
 Ukraine
-
 United Kingdom
-
United States
-
 Uruguay
-
 Uzbekistan
-
 Venezuela
-
 Vietnam
-
 Yemen
Yemen
-
 Zambia
-
 Zimbabwe
- Forex
- Crypto
