
+7.53% for Polygon — strong bounce despite ongoing negative momentum signals

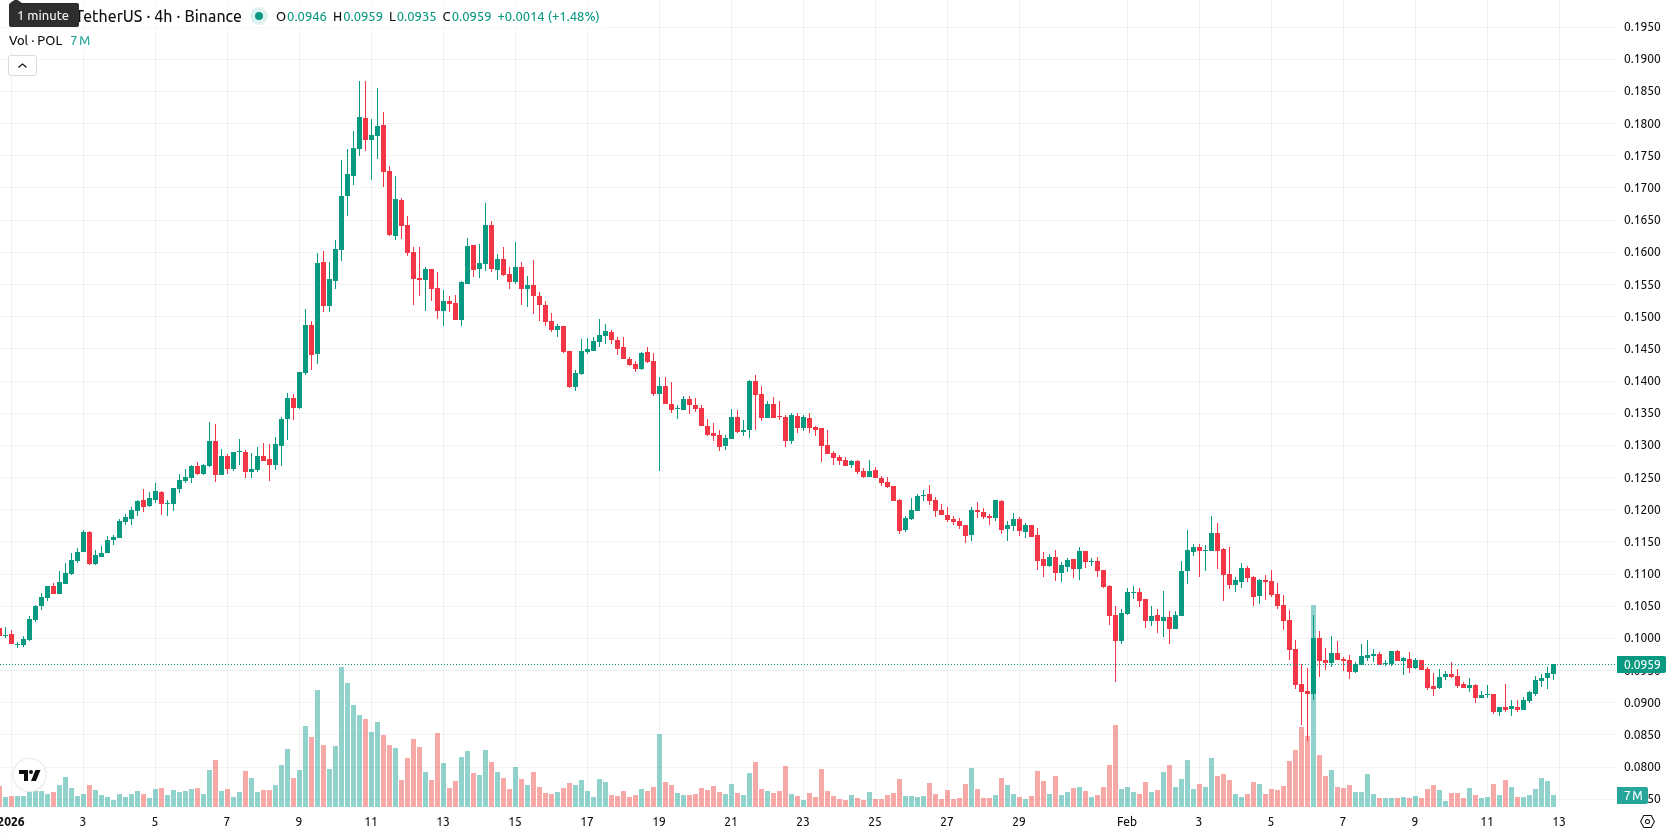
Polygon (POL, formerly MATIC) is trading at $0.0957 after a 7.53% increase ($0.0067) on the session. The current price is below the MA-20 ($0.1074), MA-50 ($0.1206), and MA-200 ($0.1799), indicating continued bearish pressure across all trend horizons.
Highlights
- Polygon joined the Enterprise Ethereum Alliance to enhance payments infrastructure and institutional adoption, underscoring its growing role in enterprise blockchain initiatives.
- In November 2025, Polygon processed over $7 billion in stablecoin peer-to-peer volume and enabled global merchant acceptance via CryptoProcessing by CoinsPaid.
- POL trades at $0.0957, below its MA-20, MA-50, and MA-200, with bearish momentum prevailing and key support at $0.0830 and resistance at $0.1167.
Broader payments adoption expands as institutional and retail ties deepen
Polygon has joined the Enterprise Ethereum Alliance to support payments infrastructure and institutional adoption initiatives. The network processed over $7 billion in stablecoin peer-to-peer volume in November 2025 and was integrated by CryptoProcessing by CoinsPaid, enabling global merchant acceptance for POL and USDC transactions. Additionally, Polygon is partnering with Global Blue and Shift4 to enable instant USDC tax refunds for international shoppers at Italian airports during the 2026 Winter Olympics, further highlighting expanding real-world applications.
Negative momentum endures as multiple indicators highlight seller control
On the technical side, POL remains under pressure with prices trading beneath key moving averages. The immediate resistance is defined by the Ichimoku Kijun at $0.1167, while near-term support is anchored by recent lows in the ongoing trading band. Daily chart indicators show persistently negative momentum, as both MACD and ADX remain bearish. Oscillators — including RSI, Commodity Channel Index, and Stochastic RSI — all signal an oversold condition, while Bull/Bear Power suggests sellers are still dominant intraday despite a strong bounce toward session highs.
Downside risks remain elevated amid tight trading range and low breakout odds
In the short term, typical volatility is expected between $0.0830 and $0.1150 over the next five trading days. The odds of a sustained price rise are low, likely under 20%, with consolidation or further downside more probable. The baseline scenario calls for continued sideways movement, capped by resistance and supported by recent lows. A bullish case would require a breakout above $0.1170, while a drop below $0.0830 would expose the asset to deeper retracement.
Previously it was reported that Polygon (POL) continues to face sustained bearish pressure, trading well below its major moving averages with weekly momentum indicators such as RSI and CCI nearing oversold levels, while the MACD and ADX affirm ongoing downside momentum. Despite increased on-chain activity, POL is expected to consolidate within a defined range, with a low probability of reversal and resistance levels capping potential upside.


-
 Afghanistan
-
 Albania
-
 Algeria
-
 Angola
-
 Argentina
-
 Armenia
-
 Australia
-
 Austria
-
 Azerbaijan
-
 Bahamas
-
 Bahrain
-
 Bangladesh
-
 Belarus
-
 Belgium
-
 Bolivia
-
 Botswana
-
 Brazil
-
 Brunei
-
 Bulgaria
-
 Cambodia
-
 Cameroon
-
 Canada
-
 Chile
Chile
-
 China
China
-
 Colombia
-
 Congo
Congo
-
 Costa Rica
-
 Cote d'Ivoire
-
 Croatia
-
 Cuba
Cuba
-
 Cyprus
-
 Czechia
-
 DR Congo
-
 Denmark
-
 Dominican Republic
-
 Ecuador
-
 Egypt
Egypt
-
 El Salvador
-
 Estonia
-
 Eswatini
-
 Ethiopia
-
 Finland
-
 France
-
 Georgia
-
 Germany
-
 Ghana
Ghana
-
 Greece
-
 Haiti
Haiti
-
 Hong Kong
-
 Hungary
-
 India
India
-
 Indonesia
-
 Iran, Islamic republic
-
 Iraq
Iraq
-
 Ireland
-
 Israel
-
 Italy
Italy
-
 Jamaica
-
 Japan
Japan
-
 Jordan
-
 Kazakhstan
-
 Kenya
Kenya
-
 Korea
Korea
-
 Kuwait
-
 Kyrgyzstan
-
 Laos
Laos
-
 Latvia
-
 Lebanon
-
 Lesotho
-
 Libya
Libya
-
 Lithuania
-
 Luxembourg
-
 Madagascar
-
 Malaysia
-
 Malta
Malta
-
 Mauritius
-
 Mexico
-
 Moldova
-
 Mongolia
-
 Montenegro
-
 Morocco
-
 Mozambique
-
 Myanmar
-
 Namibia
-
 Nepal
Nepal
-
 Netherlands
-
 New Zealand
-
 Nigeria
-
 North Macedonia
-
 Norway
-
 Oman
Oman
-
 Pakistan
-
 Palestine
-
 Panama
-
 Papua New Guinea
-
 Paraguay
-
 Peru
Peru
-
 Philippines
-
 Poland
-
 Portugal
-
 Puerto Rico
-
 Qatar
Qatar
-
 Reunion
-
 Romania
-
 Rwanda
-
 Saudi Arabia
-
 Serbia
-
 Singapore
-
 Slovakia
-
 Slovenia
-
 Somalia
-
 South Africa
-
 Spain
Spain
-
 Sri Lanka
-
 Sweden
-
 Switzerland
-
 Syria
Syria
-
 Taiwan
-
 Tajikistan
-
 Tanzania
-
 Thailand
-
 Trinidad and Tobago
-
 Tunisia
-
 Turkey
-
 UAE
UAE
-
 Uganda
-
 Ukraine
-
 United Kingdom
-
United States
-
 Uruguay
-
 Uzbekistan
-
 Venezuela
-
 Vietnam
-
 Yemen
Yemen
-
 Zambia
-
 Zimbabwe
- Forex
- Crypto
