
+8.34% for Cosmos — daily indicators turn mixed after session's sharp rally

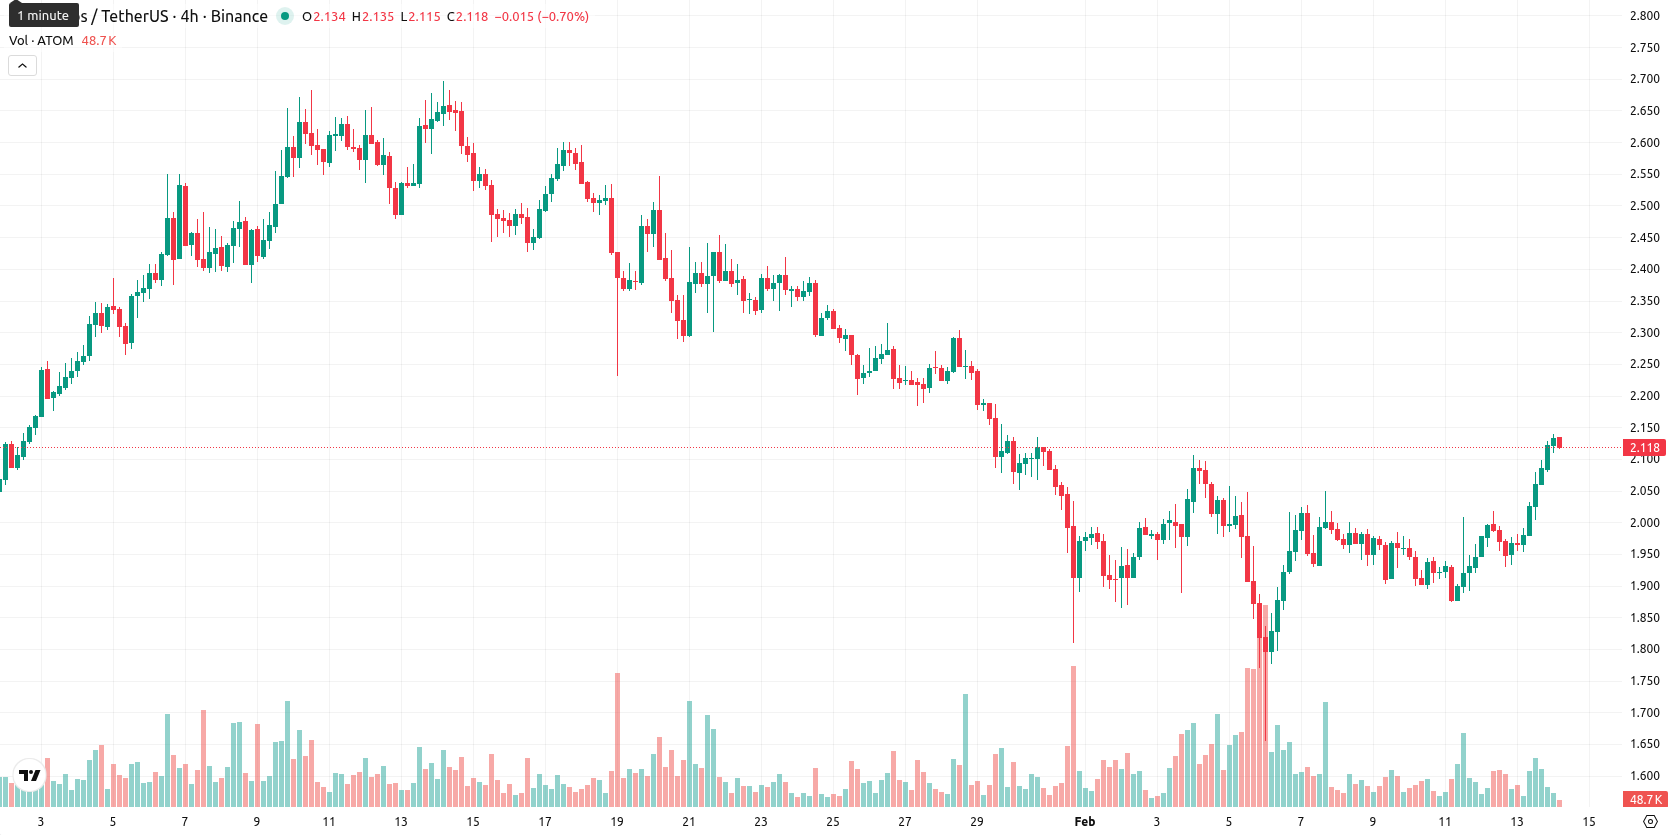
Cosmos (ATOM) is trading at $2.117, above both the MA-20 ($2.0363) and below the MA-50 ($2.2195), reflecting short-term positive momentum but lingering medium-term bearishness. The price remains under pressure on a longer timeframe, significantly beneath the MA-200 ($3.19499).
Highlights
- ATOM trades at $2.117, above MA-20 ($2.0363) but below MA-50 ($2.2195), indicating short-term bullish momentum amid medium-term bearishness.
- After an 8.34% jump from the previous close ($1.954) to today's open ($2.126), ATOM is experiencing high intraday volatility and persistent buyer interest.
- Key support rests at $2.10–$2.13 (Ichimoku Kijun) with resistance at MA-50 ($2.2195); a decisive move below support points to renewed selling pressure.
Mixed momentum signals persist as support and resistance converge
The long-term trend remains under pressure, as the price is far below the MA-200 ($3.19499), while immediate dynamic support sits near the Ichimoku Kijun at $2.1005 and the next resistance is the MA-50 at $2.2195. Momentum signals are mixed: the MACD and ADX on the daily chart suggest bearish momentum persists, but the daily RSI signals some buyer activity. The Stochastic RSI is at extreme overbought and the CCI is near neutral. Bull/Bear Power is positive, reflecting buyer dominance today, though the Awesome Oscillator remains neutral.
Volatility spikes as breakout odds remain suppressed by bearish trend
After a strong gap up from the previous close ($1.954) to today’s open ($2.126), the price has advanced 8.34% and is currently near the high of the session’s range ($2.11 — $2.139), showing high volatility and clear strength toward the highs. Oscillator divergences highlight an unstable short-term tone, with daily performance confirming the prevailing buyer momentum. Looking ahead, the expected five-day range is approximately $2.13 to $2.29, representing a typical volatility band relative to current levels. There is a very low probability (less than 20%) of a sustained upward breakout while weekly indicators remain bearish; further decline is more likely unless ATOM decisively breaks above $2.22. A move below the $2.10 — $2.13 support zone would likely expose the asset to renewed selling pressure.
Last time, analysts noted Cosmos was exhibiting mild short-term strength above its 20-day moving average but remained within an overall bearish trend, with key medium- and long-term moving averages and momentum indicators (MACD, ADX, RSI) signaling persistent downside risk. Resistance remains near the MA-50, while dynamic support is defined by the Ichimoku Kijun; despite recent intraday gains, sentiment favors further consolidation in a narrow range with limited probability of upside.


-
 Afghanistan
-
 Albania
-
 Algeria
-
 Angola
-
 Argentina
-
 Armenia
-
 Australia
-
 Austria
-
 Azerbaijan
-
 Bahamas
-
 Bahrain
-
 Bangladesh
-
 Belarus
-
 Belgium
-
 Bolivia
-
 Botswana
-
 Brazil
-
 Brunei
-
 Bulgaria
-
 Cambodia
-
 Cameroon
-
 Canada
-
 Chile
Chile
-
 China
China
-
 Colombia
-
 Congo
Congo
-
 Costa Rica
-
 Cote d'Ivoire
-
 Croatia
-
 Cuba
Cuba
-
 Cyprus
-
 Czechia
-
 DR Congo
-
 Denmark
-
 Dominican Republic
-
 Ecuador
-
 Egypt
Egypt
-
 El Salvador
-
 Estonia
-
 Eswatini
-
 Ethiopia
-
 Finland
-
 France
-
 Georgia
-
 Germany
-
 Ghana
Ghana
-
 Greece
-
 Haiti
Haiti
-
 Hong Kong
-
 Hungary
-
 India
India
-
 Indonesia
-
 Iran, Islamic republic
-
 Iraq
Iraq
-
 Ireland
-
 Israel
-
 Italy
Italy
-
 Jamaica
-
 Japan
Japan
-
 Jordan
-
 Kazakhstan
-
 Kenya
Kenya
-
 Korea
Korea
-
 Kuwait
-
 Kyrgyzstan
-
 Laos
Laos
-
 Latvia
-
 Lebanon
-
 Lesotho
-
 Libya
Libya
-
 Lithuania
-
 Luxembourg
-
 Madagascar
-
 Malaysia
-
 Malta
Malta
-
 Mauritius
-
 Mexico
-
 Moldova
-
 Mongolia
-
 Montenegro
-
 Morocco
-
 Mozambique
-
 Myanmar
-
 Namibia
-
 Nepal
Nepal
-
 Netherlands
-
 New Zealand
-
 Nigeria
-
 North Macedonia
-
 Norway
-
 Oman
Oman
-
 Pakistan
-
 Palestine
-
 Panama
-
 Papua New Guinea
-
 Paraguay
-
 Peru
Peru
-
 Philippines
-
 Poland
-
 Portugal
-
 Puerto Rico
-
 Qatar
Qatar
-
 Reunion
-
 Romania
-
 Rwanda
-
 Saudi Arabia
-
 Serbia
-
 Singapore
-
 Slovakia
-
 Slovenia
-
 Somalia
-
 South Africa
-
 Spain
Spain
-
 Sri Lanka
-
 Sweden
-
 Switzerland
-
 Syria
Syria
-
 Taiwan
-
 Tajikistan
-
 Tanzania
-
 Thailand
-
 Trinidad and Tobago
-
 Tunisia
-
 Turkey
-
 UAE
UAE
-
 Uganda
-
 Ukraine
-
 United Kingdom
-
United States
-
 Uruguay
-
 Uzbekistan
-
 Venezuela
-
 Vietnam
-
 Yemen
Yemen
-
 Zambia
-
 Zimbabwe
- Forex
- Crypto
