
Jupiter: Zero net emission push and oversold signals drive 7.37% gain

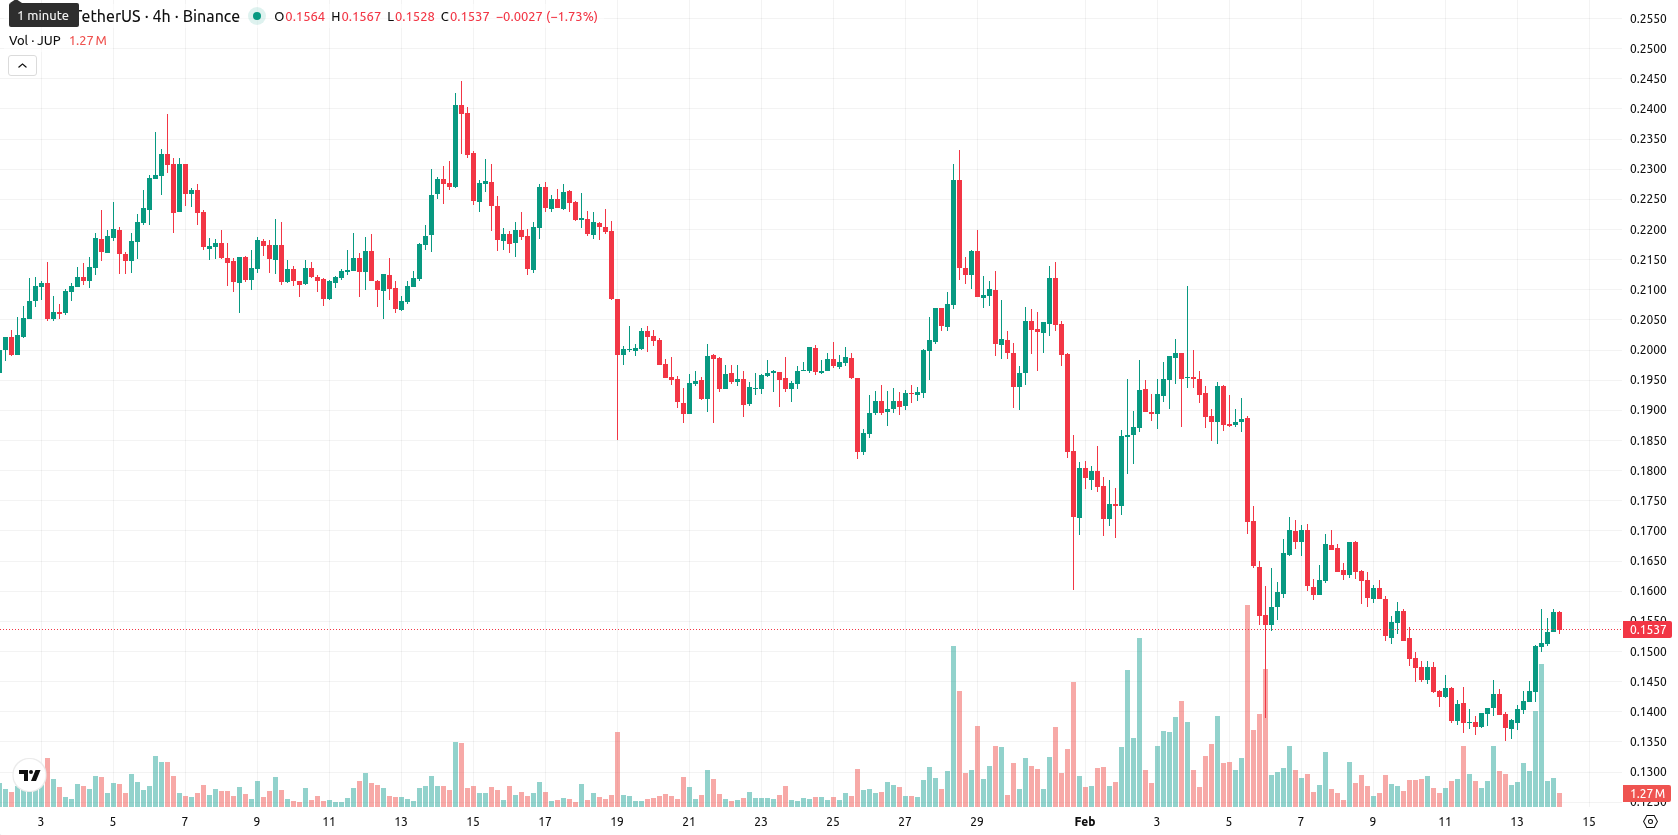
Jupiter (JUP) is trading at $0.153, which is below the MA-20 at $0.1753, MA-50 at $0.1950, and MA-200 at $0.3417. This shows bearish pressure across short-, medium-, and long-term trends, with dynamic resistance at the Ichimoku Kijun level near $0.1841 and no immediate support above the current price.
Highlights
- Jupiter proposes achieving zero net JUP token emissions by suspending core team vesting, postponing future airdrops, and adding hedging for Mercurial token sales, pending community vote.
- The proposal aims to minimize the impact of new JUP tokens entering circulation, directly addressing supply-side pressures in the token's market dynamics.
- JUP is trading at $0.153, below major moving averages, with resistance at $0.159; technicals point to continued bearish pressure and a high probability of sideways consolidation or further downside.
Token supply cuts proposed as team targets emission control
Jupiter has put forward a proposal to achieve zero net JUP token emissions, which includes postponing future airdrops, suspending core team token vesting, and introducing hedging for Mercurial token sales. These actions are designed to minimize the impact of new tokens entering circulation and await community voting.
Persistent weakness signaled as intraday gains face technical headwinds
Momentum signals on the daily chart remain weak, with the MACD and ADX signaling a sell and RSI in a bearish range. The Stochastic RSI is neutral, while CCI is near oversold, suggesting fading but not exhausted selling pressure. BBP remains negative, confirming dominant sellers intraday, and the Awesome Oscillator supports the ongoing downtrend. The price opened higher with moderate volatility and is trading near the middle of today’s range ($0.1528 – $0.1569), signaling a mild positive tone after the open, although key oscillators still indicate prevailing weakness.
Consolidation likely as downside risk outweighs limited upside chances
For the coming week, JUP is likely to trade within a typical volatility band of $0.152 to $0.159, close to current levels. Continued selling pressure is suggested by weekly RSI, ADX, MACD, and the MA-50, so upside is limited to less than 20% probability, while declines are more likely. The baseline scenario is sideways consolidation in this narrow corridor. A bullish move above $0.159 would require breaking the Ichimoku resistance and could target $0.165, while a drop below $0.152 would open up further downside, as there is no strong support nearby.
Previously it was reported that Jupiter (JUP) is trading well below its short-, medium-, and long-term moving averages, reflecting sustained seller pressure and a persistent bearish trend across all timeframes. Key technical indicators—including weak downside momentum on the MACD and ADX, oversold conditions on RSI and CCI, and resistance at the Ichimoku Kijun line—suggest continued seller dominance with initial support near recent short-term moving averages.


Latest Jupiter News


-
 Afghanistan
-
 Albania
-
 Algeria
-
 Angola
-
 Argentina
-
 Armenia
-
 Australia
-
 Austria
-
 Azerbaijan
-
 Bahamas
-
 Bahrain
-
 Bangladesh
-
 Belarus
-
 Belgium
-
 Bolivia
-
 Botswana
-
 Brazil
-
 Brunei
-
 Bulgaria
-
 Cambodia
-
 Cameroon
-
 Canada
-
 Chile
Chile
-
 China
China
-
 Colombia
-
 Congo
Congo
-
 Costa Rica
-
 Cote d'Ivoire
-
 Croatia
-
 Cuba
Cuba
-
 Cyprus
-
 Czechia
-
 DR Congo
-
 Denmark
-
 Dominican Republic
-
 Ecuador
-
 Egypt
Egypt
-
 El Salvador
-
 Estonia
-
 Eswatini
-
 Ethiopia
-
 Finland
-
 France
-
 Georgia
-
 Germany
-
 Ghana
Ghana
-
 Greece
-
 Haiti
Haiti
-
 Hong Kong
-
 Hungary
-
 India
India
-
 Indonesia
-
 Iran, Islamic republic
-
 Iraq
Iraq
-
 Ireland
-
 Israel
-
 Italy
Italy
-
 Jamaica
-
 Japan
Japan
-
 Jordan
-
 Kazakhstan
-
 Kenya
Kenya
-
 Korea
Korea
-
 Kuwait
-
 Kyrgyzstan
-
 Laos
Laos
-
 Latvia
-
 Lebanon
-
 Lesotho
-
 Libya
Libya
-
 Lithuania
-
 Luxembourg
-
 Madagascar
-
 Malaysia
-
 Malta
Malta
-
 Mauritius
-
 Mexico
-
 Moldova
-
 Mongolia
-
 Montenegro
-
 Morocco
-
 Mozambique
-
 Myanmar
-
 Namibia
-
 Nepal
Nepal
-
 Netherlands
-
 New Zealand
-
 Nigeria
-
 North Macedonia
-
 Norway
-
 Oman
Oman
-
 Pakistan
-
 Palestine
-
 Panama
-
 Papua New Guinea
-
 Paraguay
-
 Peru
Peru
-
 Philippines
-
 Poland
-
 Portugal
-
 Puerto Rico
-
 Qatar
Qatar
-
 Reunion
-
 Romania
-
 Rwanda
-
 Saudi Arabia
-
 Serbia
-
 Singapore
-
 Slovakia
-
 Slovenia
-
 Somalia
-
 South Africa
-
 Spain
Spain
-
 Sri Lanka
-
 Sweden
-
 Switzerland
-
 Syria
Syria
-
 Taiwan
-
 Tajikistan
-
 Tanzania
-
 Thailand
-
 Trinidad and Tobago
-
 Tunisia
-
 Turkey
-
 UAE
UAE
-
 Uganda
-
 Ukraine
-
 United Kingdom
-
United States
-
 Uruguay
-
 Uzbekistan
-
 Venezuela
-
 Vietnam
-
 Yemen
Yemen
-
 Zambia
-
 Zimbabwe
- Forex
- Crypto
