
Fetch.ai: Divergent momentum and overbought readings drive a 7.23% gain

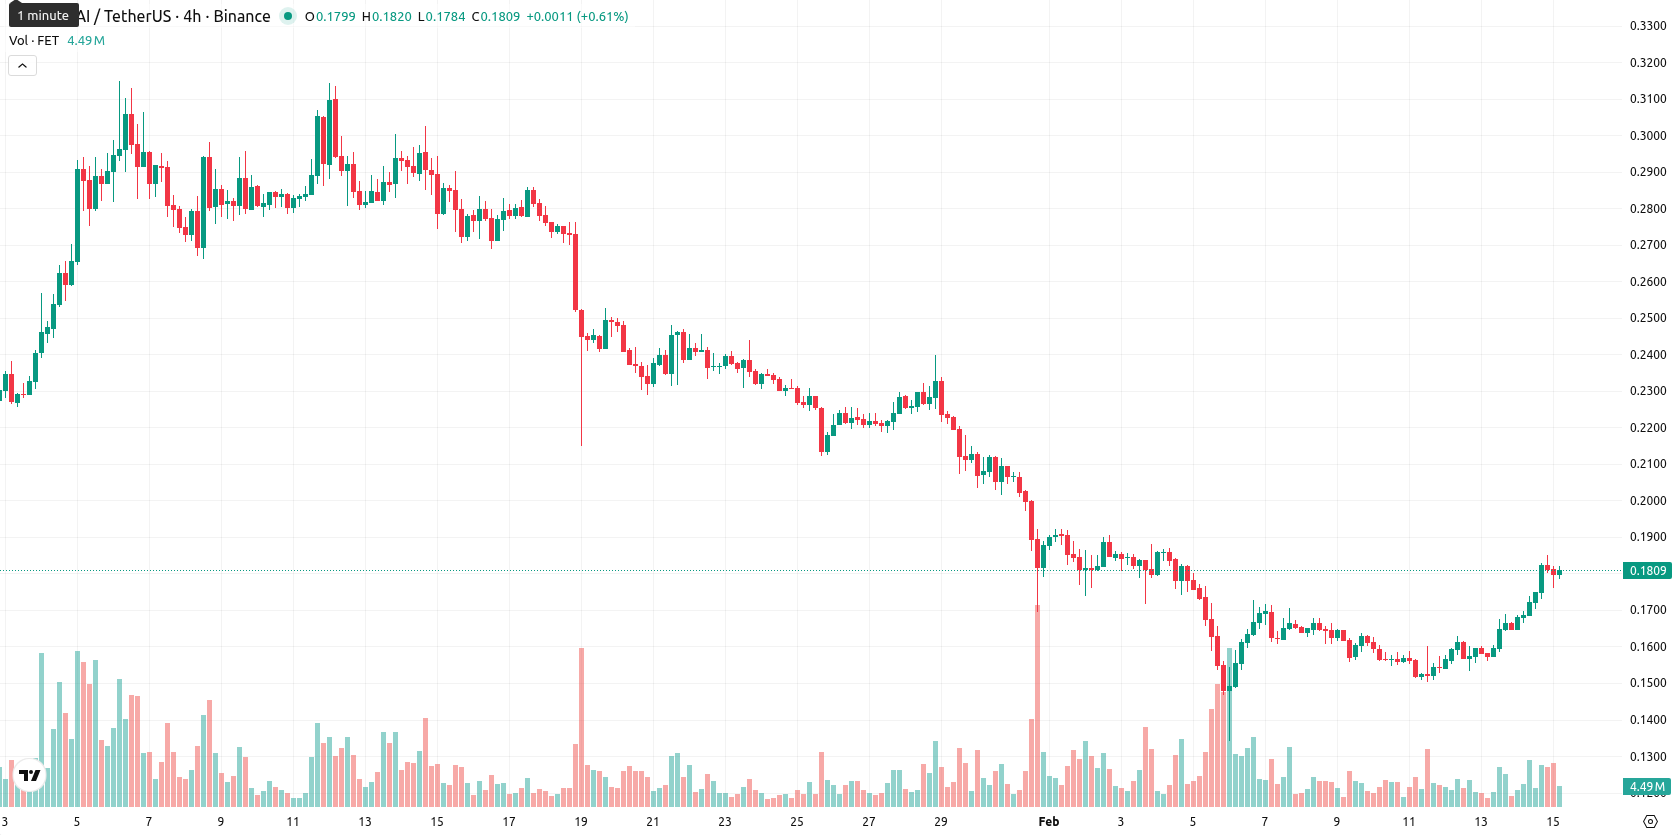
Fetch.ai (FET) is trading at $0.181, sitting just below the MA-20 ($0.1818) and well beneath both the MA-50 ($0.2245) and MA-200 ($0.3892), indicating ongoing short-, medium-, and long-term pressure from sellers.
Highlights
- FET trades at $0.181, below key moving averages (MA-20: $0.1818, MA-50: $0.2245, MA-200: $0.3892), indicating persistent bearish pressure across all timeframes.
- Momentum signals are mixed: MACD issues strong sell, daily/weekly RSI declines from neutral (45), but intraday action saw a volatile 7.23% gain ($0.0122), closing near the high.
- Expected price range for FET is $0.174–$0.189 next week, with sub-20% probability of a meaningful rally and notable risk of renewed selling below $0.174.
Mixed momentum and volatility as intraday gains test resistance
Immediate dynamic support is seen near the Ichimoku Kijun at $0.1920, with the next notable resistance at the MA-50 level. Momentum indicators offer mixed signals: the MACD gives a strong sell on the daily and weekly timeframes, while ADX D1 points to a selling environment with notable trend strength, though its weekly reading is neutral. The RSI sits in neutral territory at 45 but is trending down both daily and weekly, while Stochastic RSI is overbought and the CCI is neutral, creating a divergence between momentum and overbought/oversold conditions. Bull/Bear Power reveals buyer dominance intraday, which aligns with today’s solid 7.23% gain ($0.0122) and upward direction; there was no gap between yesterday’s close and today’s open, and the current price hovers near today’s intraday high, reflecting high volatility and sustained strength toward the session highs.
Decline risk prevails as range-bound outlook limits upside
For the coming week, the adjusted expected price range is $0.174 to $0.189. There is a very low probability (less than 20%) of a sustained price increase, making the risk of decline notably more likely. Baseline scenario: FET remains in a sideways band between $0.174 support and $0.189 resistance. Bullish scenario: a breakout above $0.189 could open the way to higher resistance levels, but is currently unlikely. Bearish scenario: a drop below $0.174 would signal renewed selling pressure and potential for deeper losses.
Last time, analysts noted that FET is trading just above short-term support at the MA-20 but remains under medium- and long-term bearish pressure, with resistance near $0.1933 and initial support at the MA-20. Technical indicators including a strong sell on the MACD, persistent ADX selling pressure, and overbought Stochastic RSI suggest ongoing weak momentum and elevated pullback risks despite recent gains.


Latest FET News


-
 Afghanistan
-
 Albania
-
 Algeria
-
 Angola
-
 Argentina
-
 Armenia
-
 Australia
-
 Austria
-
 Azerbaijan
-
 Bahamas
-
 Bahrain
-
 Bangladesh
-
 Belarus
-
 Belgium
-
 Bolivia
-
 Botswana
-
 Brazil
-
 Brunei
-
 Bulgaria
-
 Cambodia
-
 Cameroon
-
 Canada
-
 Chile
Chile
-
 China
China
-
 Colombia
-
 Congo
Congo
-
 Costa Rica
-
 Cote d'Ivoire
-
 Croatia
-
 Cuba
Cuba
-
 Cyprus
-
 Czechia
-
 DR Congo
-
 Denmark
-
 Dominican Republic
-
 Ecuador
-
 Egypt
Egypt
-
 El Salvador
-
 Estonia
-
 Eswatini
-
 Ethiopia
-
 Finland
-
 France
-
 Georgia
-
 Germany
-
 Ghana
Ghana
-
 Greece
-
 Haiti
Haiti
-
 Hong Kong
-
 Hungary
-
 India
India
-
 Indonesia
-
 Iran, Islamic republic
-
 Iraq
Iraq
-
 Ireland
-
 Israel
-
 Italy
Italy
-
 Jamaica
-
 Japan
Japan
-
 Jordan
-
 Kazakhstan
-
 Kenya
Kenya
-
 Korea
Korea
-
 Kuwait
-
 Kyrgyzstan
-
 Laos
Laos
-
 Latvia
-
 Lebanon
-
 Lesotho
-
 Libya
Libya
-
 Lithuania
-
 Luxembourg
-
 Madagascar
-
 Malaysia
-
 Malta
Malta
-
 Mauritius
-
 Mexico
-
 Moldova
-
 Mongolia
-
 Montenegro
-
 Morocco
-
 Mozambique
-
 Myanmar
-
 Namibia
-
 Nepal
Nepal
-
 Netherlands
-
 New Zealand
-
 Nigeria
-
 North Macedonia
-
 Norway
-
 Oman
Oman
-
 Pakistan
-
 Palestine
-
 Panama
-
 Papua New Guinea
-
 Paraguay
-
 Peru
Peru
-
 Philippines
-
 Poland
-
 Portugal
-
 Puerto Rico
-
 Qatar
Qatar
-
 Reunion
-
 Romania
-
 Rwanda
-
 Saudi Arabia
-
 Serbia
-
 Singapore
-
 Slovakia
-
 Slovenia
-
 Somalia
-
 South Africa
-
 Spain
Spain
-
 Sri Lanka
-
 Sweden
-
 Switzerland
-
 Syria
Syria
-
 Taiwan
-
 Tajikistan
-
 Tanzania
-
 Thailand
-
 Trinidad and Tobago
-
 Tunisia
-
 Turkey
-
 UAE
UAE
-
 Uganda
-
 Ukraine
-
 United Kingdom
-
United States
-
 Uruguay
-
 Uzbekistan
-
 Venezuela
-
 Vietnam
-
 Yemen
Yemen
-
 Zambia
-
 Zimbabwe
- Forex
- Crypto
