
NEAR breaks below key averages, consolidates above $1.04 support as downside risk persists – weekly report

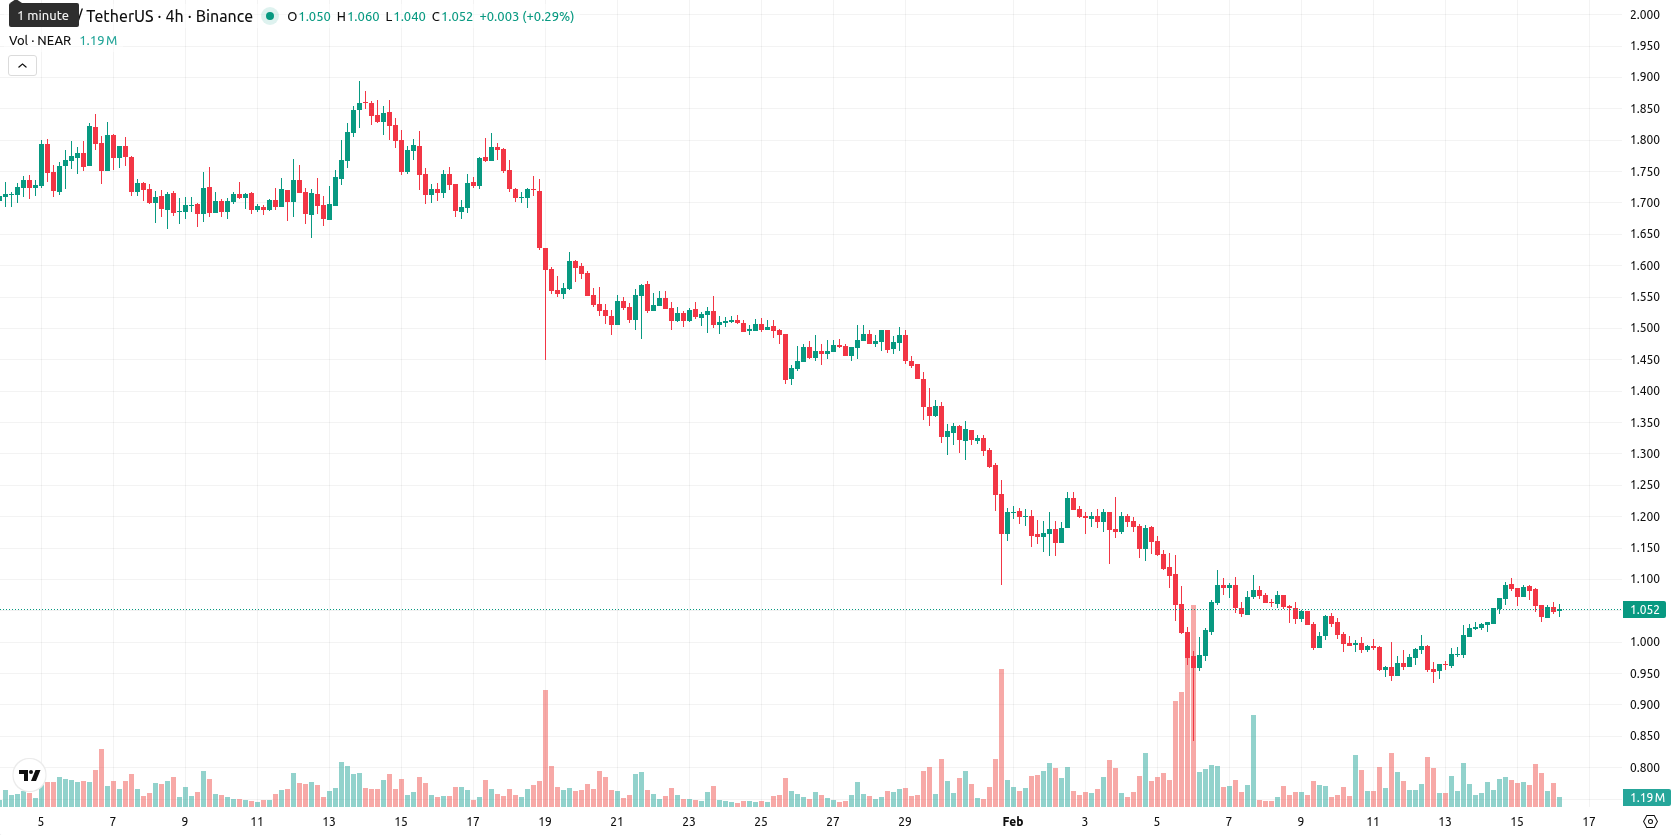
NEAR is trading at $1.0492, posting a weekly loss and slipping 2.85% over the last seven days. The asset remains below its MA-20 ($1.1440), MA-50 ($1.4417), and MA-200 ($2,1158) on the weekly chart, highlighting persistent selling pressure across all major timeframes.
Highlights
- NEAR is trading at $1.0492, below its MA-20 ($1.1440), MA-50 ($1.4417), and MA-200 ($2.1158), indicating sustained seller pressure across all timeframes.
- Daily technicals are bearish, with negative momentum from MACD and ADX, RSI at 36.88 approaching oversold, and the current trend down 2.85%.
- Expect price consolidation between $0.95 and $1.13 this week; a break below $0.95 signals further weakness, while resistance stands at $1.13–$1.2075.
Negative weekly momentum as indicators diverge and support holds
On the weekly timeframe, NEAR continues to trade below all its key moving averages: MA-20 at $1.1440, MA-50 at $1.4417, and MA-200 at $2,1158. Technical momentum is negative, with weekly indicators such as RSI at 36.88 suggesting the asset is nearing oversold territory. However, divergence among oscillators is evident as the Stochastic RSI shows overbought conditions and the CCI remains neutral. Dynamic resistance is indicated by the Ichimoku Kijun near $1.2075, while immediate support lies around psychological levels at $1.04.
Consolidation expected as rebound risk remains limited next week
Looking ahead, NEAR is likely to remain under pressure for the next 5–7 trading days. The expected range is $0.95 to $1.13, with the probability of a meaningful rebound remaining below 20%. Baseline expectations point to consolidation within the $0.95–$1.13 band, but a break above $1.13 could trigger a move toward resistance. Conversely, a decline below $0.95 would confirm ongoing weakness and further downside risk.
Previously it was reported that NEAR is showing a modest intraday gain but remains under heavy selling pressure, trading below all major moving averages and encountering persistent bearish momentum according to key indicators like MACD, ADX, and negative Bull/Bear Power. Current technicals highlight mixed signals with oversold RSI and CCI contrasted by an overbought Stochastic RSI, as the asset holds just below resistance near $1.09 and faces limited breakout risk with ongoing range-bound trade likely.


-
 Afghanistan
-
 Albania
-
 Algeria
-
 Angola
-
 Argentina
-
 Armenia
-
 Australia
-
 Austria
-
 Azerbaijan
-
 Bahamas
-
 Bahrain
-
 Bangladesh
-
 Belarus
-
 Belgium
-
 Bolivia
-
 Botswana
-
 Brazil
-
 Brunei
-
 Bulgaria
-
 Cambodia
-
 Cameroon
-
 Canada
-
 Chile
Chile
-
 China
China
-
 Colombia
-
 Congo
Congo
-
 Costa Rica
-
 Cote d'Ivoire
-
 Croatia
-
 Cuba
Cuba
-
 Cyprus
-
 Czechia
-
 DR Congo
-
 Denmark
-
 Dominican Republic
-
 Ecuador
-
 Egypt
Egypt
-
 El Salvador
-
 Estonia
-
 Eswatini
-
 Ethiopia
-
 Finland
-
 France
-
 Georgia
-
 Germany
-
 Ghana
Ghana
-
 Greece
-
 Haiti
Haiti
-
 Hong Kong
-
 Hungary
-
 India
India
-
 Indonesia
-
 Iran, Islamic republic
-
 Iraq
Iraq
-
 Ireland
-
 Israel
-
 Italy
Italy
-
 Jamaica
-
 Japan
Japan
-
 Jordan
-
 Kazakhstan
-
 Kenya
Kenya
-
 Korea
Korea
-
 Kuwait
-
 Kyrgyzstan
-
 Laos
Laos
-
 Latvia
-
 Lebanon
-
 Lesotho
-
 Libya
Libya
-
 Lithuania
-
 Luxembourg
-
 Madagascar
-
 Malaysia
-
 Malta
Malta
-
 Mauritius
-
 Mexico
-
 Moldova
-
 Mongolia
-
 Montenegro
-
 Morocco
-
 Mozambique
-
 Myanmar
-
 Namibia
-
 Nepal
Nepal
-
 Netherlands
-
 New Zealand
-
 Nigeria
-
 North Macedonia
-
 Norway
-
 Oman
Oman
-
 Pakistan
-
 Palestine
-
 Panama
-
 Papua New Guinea
-
 Paraguay
-
 Peru
Peru
-
 Philippines
-
 Poland
-
 Portugal
-
 Puerto Rico
-
 Qatar
Qatar
-
 Reunion
-
 Romania
-
 Rwanda
-
 Saudi Arabia
-
 Serbia
-
 Singapore
-
 Slovakia
-
 Slovenia
-
 Somalia
-
 South Africa
-
 Spain
Spain
-
 Sri Lanka
-
 Sweden
-
 Switzerland
-
 Syria
Syria
-
 Taiwan
-
 Tajikistan
-
 Tanzania
-
 Thailand
-
 Trinidad and Tobago
-
 Tunisia
-
 Turkey
-
 UAE
UAE
-
 Uganda
-
 Ukraine
-
 United Kingdom
-
United States
-
 Uruguay
-
 Uzbekistan
-
 Venezuela
-
 Vietnam
-
 Yemen
Yemen
-
 Zambia
-
 Zimbabwe
- Forex
- Crypto
