
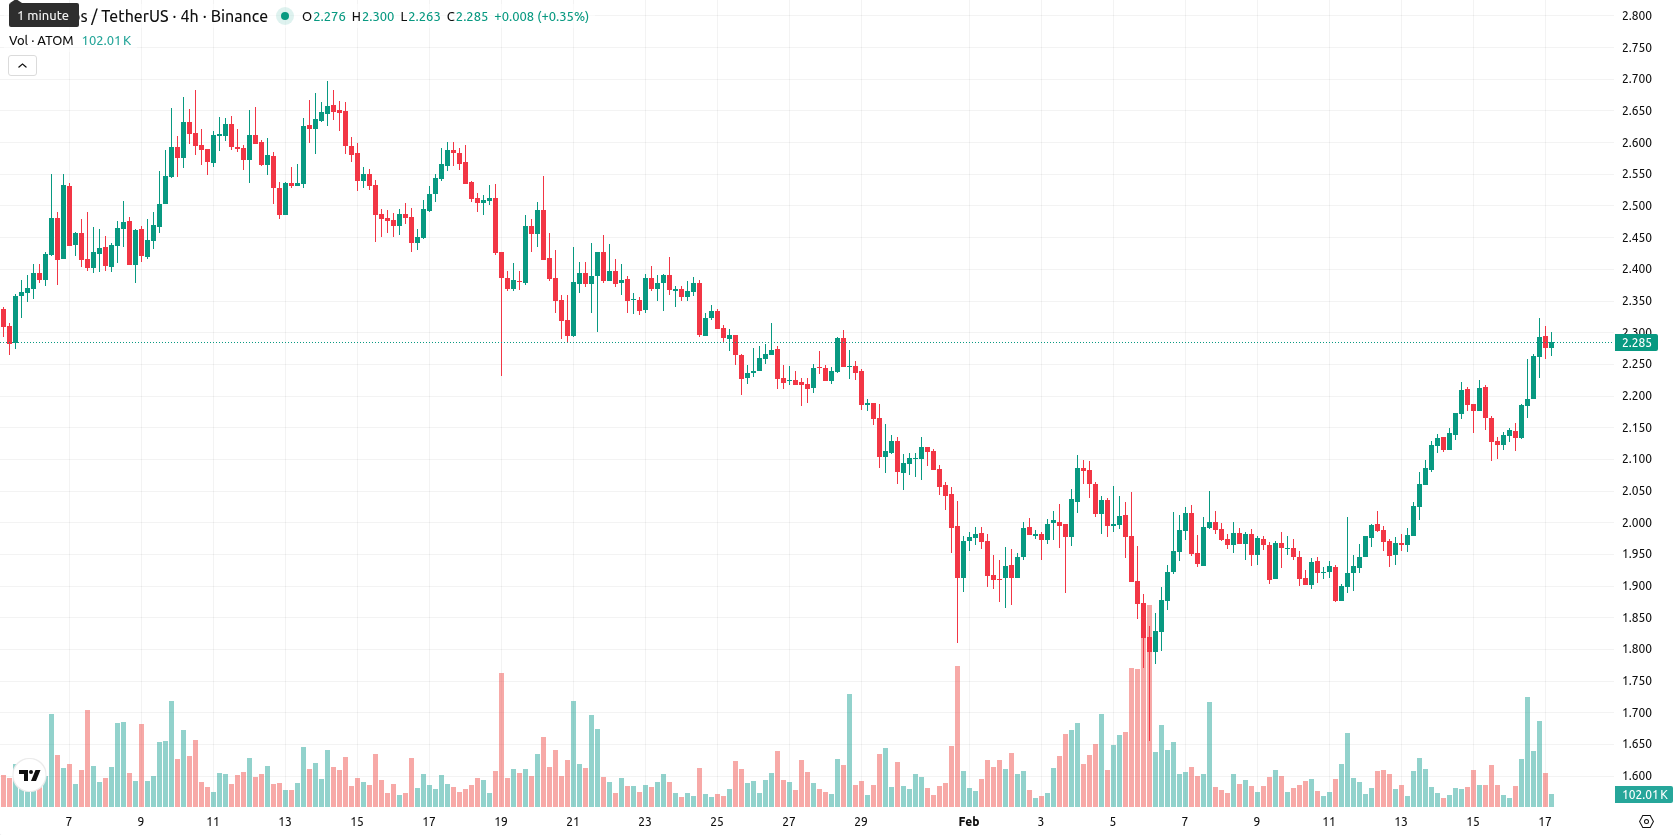
Cosmos price prediction: Will rally stall soon? ATOM jumps 8.06% to $2.292

Cosmos (ATOM) is trading at $2.292, above the MA-20 ($2.03255) and MA-50 ($2.22802) but still well below the MA-200 ($3.16191), which indicates sustained short- and medium-term buying momentum despite long-term structural weakness.
Highlights
- ATOM is trading at $2.292, above both the MA-20 ($2.03255) and MA-50 ($2.22802), but remains below the long-term MA-200 ($3.16191), signaling short-term momentum within a bearish larger trend.
- Momentum indicators are mixed: RSI (59.77) shows moderate bullishness, while Stochastic RSI and Commodity Channel Index indicate overbought conditions and possible exhaustion.
- The price is expected to consolidate in a $2.15–$2.35 corridor over the next week, with less than a 20% probability of further price increases and downside pressure from weekly indicators.
Mixed momentum signals as resistance holds near session highs
The nearest dynamic support is the Ichimoku Kijun at $2.047, while resistance is seen at the MA-50 ($2.22802) just below the current price; with no death or golden cross signaled, the long-term trend remains under pressure from sellers. Momentum signals are mixed on the daily timeframe: MACD and ADX both point to waning upward momentum, while RSI (59.77) suggests moderate bullishness, but the Stochastic RSI and Commodity Channel Index both flag overbought conditions. Bull/Bear Power is positive (0.231), confirming buyer dominance intraday, though not at an extreme; the Awesome Oscillator remains neutral and does not add confirmation to the trend. The current session shows notable bullish activity, up $0.171 or 8.06% from the previous close, with today’s trading gapping higher at the open and the price now near the intraday high of the $2.259 – $2.309 range; this implies high intraday volatility and sustained strength toward session highs, even as some momentum oscillators warn of possible exhaustion.
Downside risk favored as momentum signals suggest decline likely
For the next week, the price corridor is set at $2.15 – $2.35, reflecting typical volatility and the need to keep the range within ±10% of $2.292. The probability of further price increase is very low (less than 20%), with a price decline more likely, based on all weekly momentum indicators (RSI, ADX, MACD, MA-50) signaling downward pressure. Baseline scenario: price consolidates in a sideways band between support at $2.15 and resistance near $2.35. Bullish continuation would require a sustained break above $2.35, but overbought oscillators make this unlikely, while a fall below $2.15 could trigger a retest of the Ichimoku Kijun ($2.047) or lower support levels.
Last time, analysts noted that Cosmos (ATOM) is demonstrating a short-term bullish tilt as it trades above key short- and medium-term moving averages but remains below its long-term moving average, signaling cautious longer-term sentiment. Technical indicators including an elevated RSI and overbought oscillators point to increased consolidation or a potential pullback, with price expected to remain rangebound between established support and resistance levels.


-
 Afghanistan
-
 Albania
-
 Algeria
-
 Angola
-
 Argentina
-
 Armenia
-
 Australia
-
 Austria
-
 Azerbaijan
-
 Bahamas
-
 Bahrain
-
 Bangladesh
-
 Belarus
-
 Belgium
-
 Bolivia
-
 Botswana
-
 Brazil
-
 Brunei
-
 Bulgaria
-
 Cambodia
-
 Cameroon
-
 Canada
-
 Chile
Chile
-
 China
China
-
 Colombia
-
 Congo
Congo
-
 Costa Rica
-
 Cote d'Ivoire
-
 Croatia
-
 Cuba
Cuba
-
 Cyprus
-
 Czechia
-
 DR Congo
-
 Denmark
-
 Dominican Republic
-
 Ecuador
-
 Egypt
Egypt
-
 El Salvador
-
 Estonia
-
 Eswatini
-
 Ethiopia
-
 Finland
-
 France
-
 Georgia
-
 Germany
-
 Ghana
Ghana
-
 Greece
-
 Haiti
Haiti
-
 Hong Kong
-
 Hungary
-
 India
India
-
 Indonesia
-
 Iran, Islamic republic
-
 Iraq
Iraq
-
 Ireland
-
 Israel
-
 Italy
Italy
-
 Jamaica
-
 Japan
Japan
-
 Jordan
-
 Kazakhstan
-
 Kenya
Kenya
-
 Korea
Korea
-
 Kuwait
-
 Kyrgyzstan
-
 Laos
Laos
-
 Latvia
-
 Lebanon
-
 Lesotho
-
 Libya
Libya
-
 Lithuania
-
 Luxembourg
-
 Madagascar
-
 Malaysia
-
 Malta
Malta
-
 Mauritius
-
 Mexico
-
 Moldova
-
 Mongolia
-
 Montenegro
-
 Morocco
-
 Mozambique
-
 Myanmar
-
 Namibia
-
 Nepal
Nepal
-
 Netherlands
-
 New Zealand
-
 Nigeria
-
 North Macedonia
-
 Norway
-
 Oman
Oman
-
 Pakistan
-
 Palestine
-
 Panama
-
 Papua New Guinea
-
 Paraguay
-
 Peru
Peru
-
 Philippines
-
 Poland
-
 Portugal
-
 Puerto Rico
-
 Qatar
Qatar
-
 Reunion
-
 Romania
-
 Rwanda
-
 Saudi Arabia
-
 Serbia
-
 Singapore
-
 Slovakia
-
 Slovenia
-
 Somalia
-
 South Africa
-
 Spain
Spain
-
 Sri Lanka
-
 Sweden
-
 Switzerland
-
 Syria
Syria
-
 Taiwan
-
 Tajikistan
-
 Tanzania
-
 Thailand
-
 Trinidad and Tobago
-
 Tunisia
-
 Turkey
-
 UAE
UAE
-
 Uganda
-
 Ukraine
-
 United Kingdom
-
United States
-
 Uruguay
-
 Uzbekistan
-
 Venezuela
-
 Vietnam
-
 Yemen
Yemen
-
 Zambia
-
 Zimbabwe
- Forex
- Crypto
