
Cosmos: Mixed technical readings drive a sharp slide below $2.31

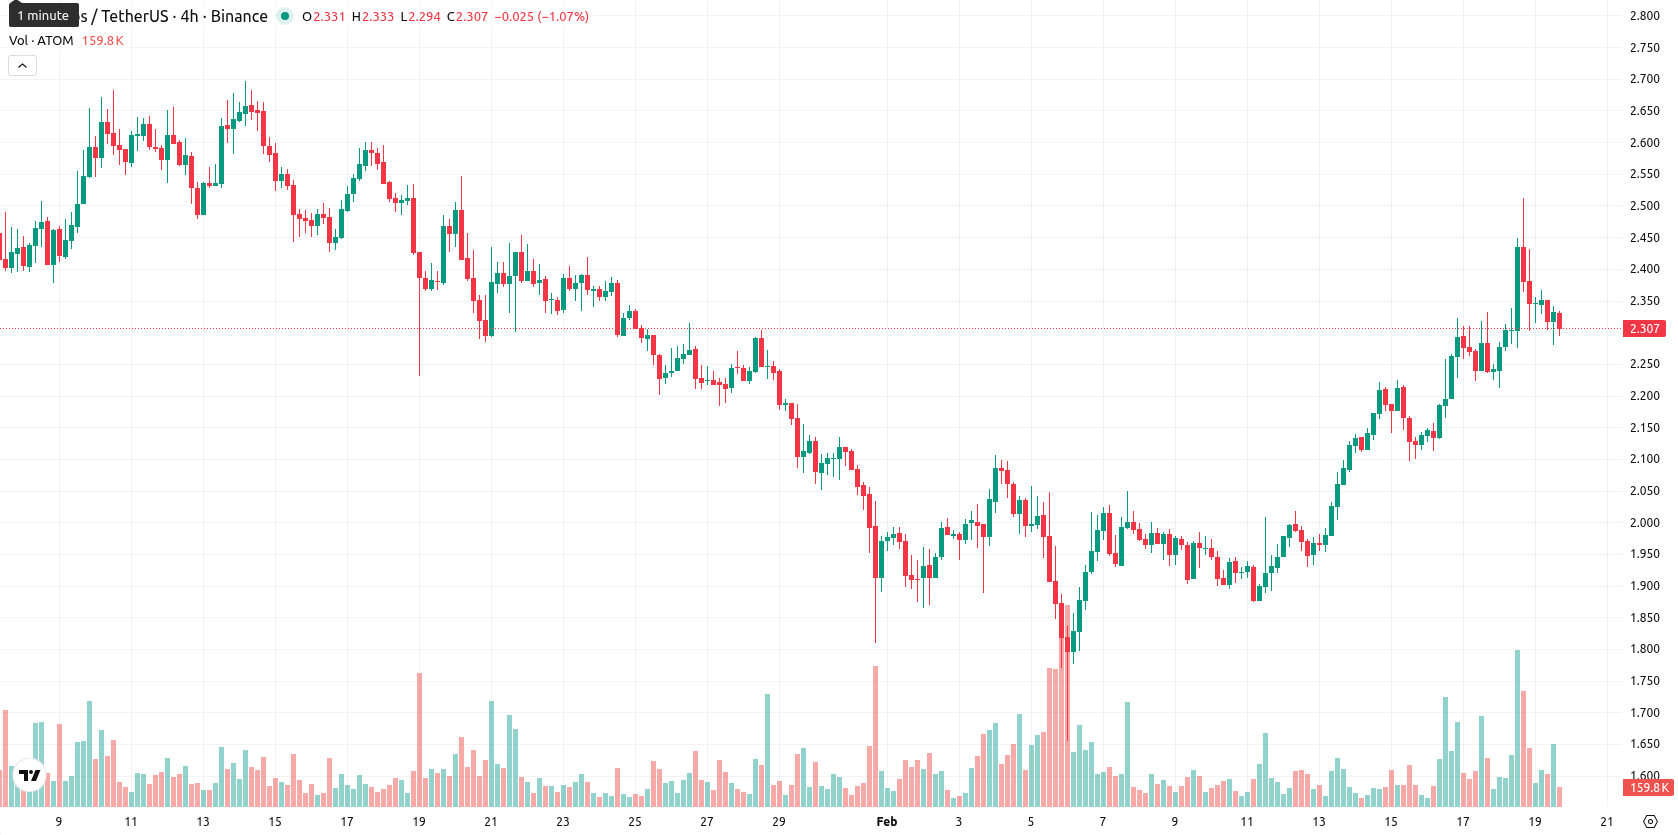
Cosmos (ATOM) is trading at $2.304, showing a daily decline of 7.32% and holding above the MA-20 ($2.0428) and MA-50 ($2.2408), which signals solid short- and medium-term bullish momentum despite trading well below the MA-200 ($3.1436) and facing long-term resistance.
Highlights
- Cosmos has regained market attention due to recent developments emphasizing its leadership in decentralized blockchain networks and cross-chain interoperability.
- The asset is experiencing renewed community momentum and increasing recognition across the blockchain sector as it advances its cross-chain focus.
- ATOM trades at $2.304, above the MA-20 and MA-50 but well below the MA-200 ($3.1436), with immediate resistance at $2.40 and support at $2.08; further upside is unlikely as technicals indicate continued downside risk.
Renewed interest as cross-chain advances drive community momentum
Cosmos, the native blockchain interoperability project, has recaptured market attention following recent developments that highlight its ongoing leadership within decentralized blockchain networks. The asset is garnering renewed interest due to its focus on cross-chain functionality, which has contributed to momentum in the project community. These advances arrive as Cosmos gains wider recognition within the blockchain sector.
Short-term strength capped by resistance and mixed technical signals
On the technical side, ATOM maintains positive short- and medium-term momentum, holding above both the MA-20 and MA-50, but remains capped below the MA-200, reflecting longer-term seller dominance. Dynamic support is evident with the Ichimoku Kijun level at $2.0805, while resistance is found near the MA-50 and the round $2.40 mark. Daily technical indicators suggest mixed momentum — the ADX shows moderate buying, the MACD is neutral, the RSI is bullish at 60.5, and both the Stochastic RSI and CCI indicate overbought conditions. Bull/Bear Power is positive, supporting buyers' strength today, but the Awesome Oscillator remains neutral, and intraday volatility is high in the $2.28 – $2.365 range, reflecting notable pressure near session lows.
Range-bound outlook with elevated downside risk on support breach
Looking into the short term, ATOM is expected to trade between $2.12 and $2.55, representing a typical volatility band relative to current levels. Technical signals favor sideways price action, as momentum signals and overbought oscillators diverge, pointing to heightened caution. The probability of further price gains over the next five trading days is below 20%, while downside risk is elevated, especially if support at $2.12 breaks, which could open a move toward $2.08 or lower. A sustained push above $2.40 would be required to trigger renewed bullish momentum toward the upper boundary of the stated range.
Last time, analysts noted that Cosmos was trading above its short- and medium-term moving averages, with bullish intraday momentum and improving sentiment driven by DeFi innovation and capital inflows, though long-term weakness persists below the 200-day average. Technical signals such as a neutral MACD, weak ADX, bullish but not overextended RSI, and overbought oscillators indicate that further upside is likely capped, with the price expected to remain range-bound between near-term support and resistance levels.


-
 Afghanistan
-
 Albania
-
 Algeria
-
 Angola
-
 Argentina
-
 Armenia
-
 Australia
-
 Austria
-
 Azerbaijan
-
 Bahamas
-
 Bahrain
-
 Bangladesh
-
 Belarus
-
 Belgium
-
 Bolivia
-
 Botswana
-
 Brazil
-
 Brunei
-
 Bulgaria
-
 Cambodia
-
 Cameroon
-
 Canada
-
 Chile
Chile
-
 China
China
-
 Colombia
-
 Congo
Congo
-
 Costa Rica
-
 Cote d'Ivoire
-
 Croatia
-
 Cuba
Cuba
-
 Cyprus
-
 Czechia
-
 DR Congo
-
 Denmark
-
 Dominican Republic
-
 Ecuador
-
 Egypt
Egypt
-
 El Salvador
-
 Estonia
-
 Eswatini
-
 Ethiopia
-
 Finland
-
 France
-
 Georgia
-
 Germany
-
 Ghana
Ghana
-
 Greece
-
 Haiti
Haiti
-
 Hong Kong
-
 Hungary
-
 India
India
-
 Indonesia
-
 Iran, Islamic republic
-
 Iraq
Iraq
-
 Ireland
-
 Israel
-
 Italy
Italy
-
 Jamaica
-
 Japan
Japan
-
 Jordan
-
 Kazakhstan
-
 Kenya
Kenya
-
 Korea
Korea
-
 Kuwait
-
 Kyrgyzstan
-
 Laos
Laos
-
 Latvia
-
 Lebanon
-
 Lesotho
-
 Libya
Libya
-
 Lithuania
-
 Luxembourg
-
 Madagascar
-
 Malaysia
-
 Malta
Malta
-
 Mauritius
-
 Mexico
-
 Moldova
-
 Mongolia
-
 Montenegro
-
 Morocco
-
 Mozambique
-
 Myanmar
-
 Namibia
-
 Nepal
Nepal
-
 Netherlands
-
 New Zealand
-
 Nigeria
-
 North Macedonia
-
 Norway
-
 Oman
Oman
-
 Pakistan
-
 Palestine
-
 Panama
-
 Papua New Guinea
-
 Paraguay
-
 Peru
Peru
-
 Philippines
-
 Poland
-
 Portugal
-
 Puerto Rico
-
 Qatar
Qatar
-
 Reunion
-
 Romania
-
 Rwanda
-
 Saudi Arabia
-
 Serbia
-
 Singapore
-
 Slovakia
-
 Slovenia
-
 Somalia
-
 South Africa
-
 Spain
Spain
-
 Sri Lanka
-
 Sweden
-
 Switzerland
-
 Syria
Syria
-
 Taiwan
-
 Tajikistan
-
 Tanzania
-
 Thailand
-
 Trinidad and Tobago
-
 Tunisia
-
 Turkey
-
 UAE
UAE
-
 Uganda
-
 Ukraine
-
 United Kingdom
-
United States
-
 Uruguay
-
 Uzbekistan
-
 Venezuela
-
 Vietnam
-
 Yemen
Yemen
-
 Zambia
-
 Zimbabwe
- Forex
- Crypto
