
Sui: Technical weakness persists despite 7.06% spike after ETF announcements

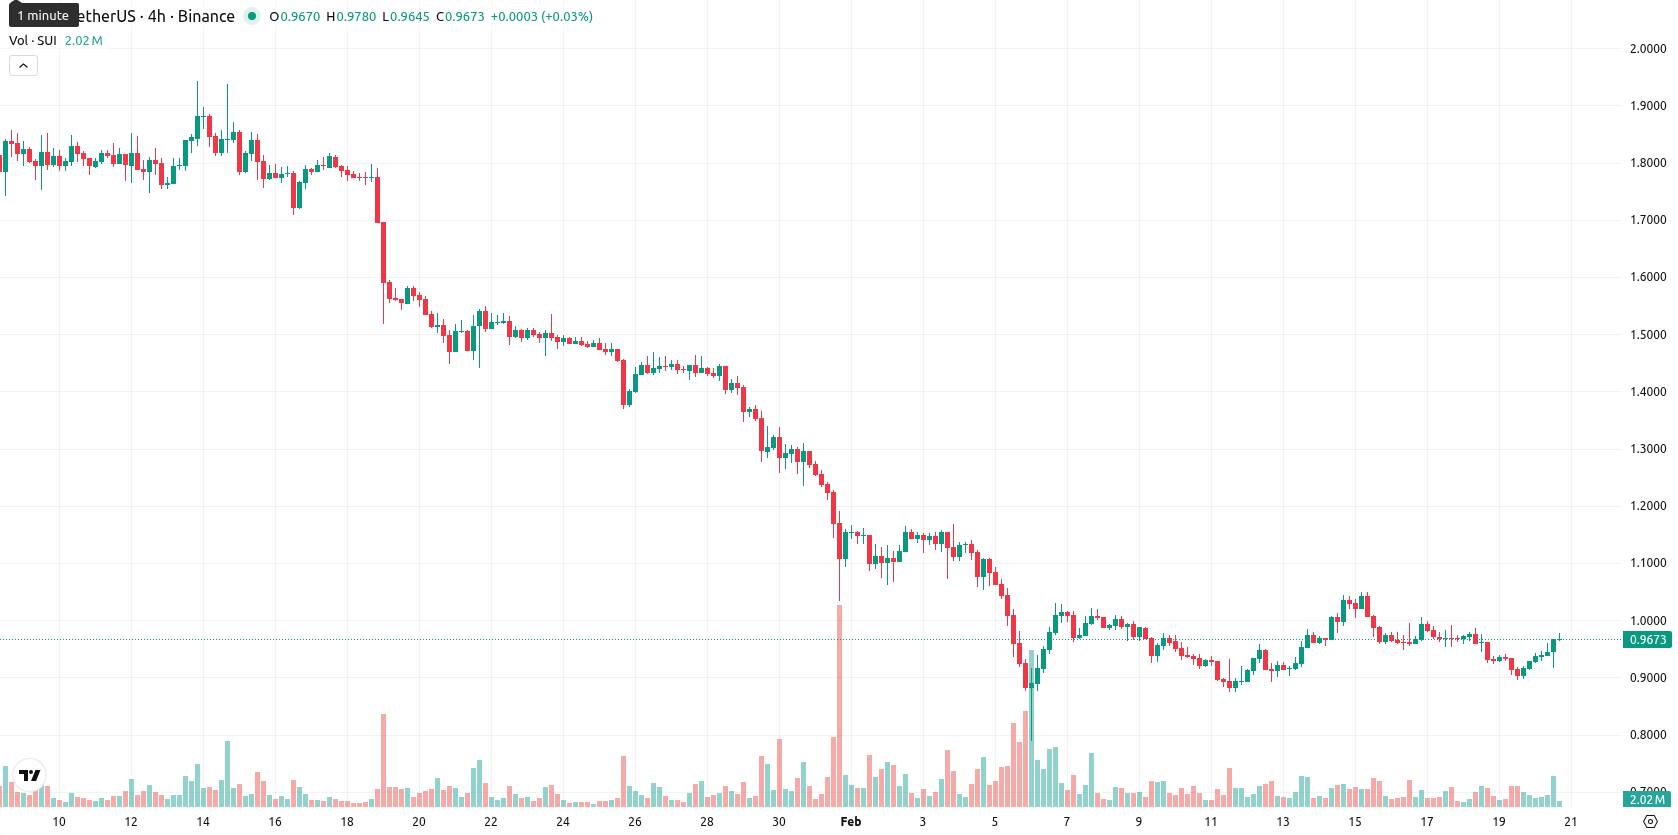
Sui (SUI) is trading below the MA-20 ($0.9983), MA-50 ($1.3821), and MA-200 ($2.3129), signaling continued short-, medium-, and long-term downward pressure. The daily performance is strong, with a 7.06% gain to $0.9666 after a small opening gap and price testing session highs, but sellers remain dominant as SUI stays below key moving averages and the Ichimoku Kijun at $1.1410, which now serves as immediate resistance.
Highlights
- Grayscale and Canary Capital launched the first US spot Sui ETFs (GSUI on NYSE Arca, SUIS on Nasdaq) on February 18, 2026, providing regulated, direct Sui exposure.
- Both ETFs allocate all holdings to network staking from inception, with Canary’s ETF delivering quarterly staking rewards to investors for institutional and retail access.
- SUI trades below MA-20 ($0.9983), MA-50 ($1.3821), and MA-200 ($2.3129), with $1.14 as immediate resistance and continued seller pressure evident across momentum indicators.
US spot Sui ETFs debut as staking incentives attract diverse demand
On February 18, 2026, Grayscale and Canary Capital introduced the first US spot Sui ETFs, GSUI on NYSE Arca and SUIS on Nasdaq. Both funds offer direct, regulated exposure to Sui, and all holdings are allocated to network staking from inception. Canary’s ETF pays out staking rewards to investors quarterly, while the new products bring a compliant access point for both institutional and retail market participants interested in Sui staking rewards.
Persistent seller momentum as oversold readings meet strong trend signals
Technical analysis indicates pressure across all key timeframes, with SUI trading well below MA-20, MA-50, and MA-200, and the Ichimoku Kijun at $1.1410 acting as immediate resistance. Momentum remains weak as the MACD signals Strong Sell on both daily and weekly intervals. The ADX is elevated (D1: 45.47), confirming a strong trend to the downside. The RSI (D1: 34.16, W1: 30.99) and CCI (D1: -84.09) are mildly oversold, while the Stochastic RSI is neutral, and negative Bull/Bear Power readings reinforce persistent seller dominance despite recent strong daily gains and intraday volatility.
Bearish continuation risk as weak breakout odds cap short-term rally
For the next five trading days, SUI is expected to fluctuate within a $0.8700 to $1.0700 volatility band relative to current levels. The probability of a significant upward move is low, making further price declines more likely. The baseline forecast anticipates sideways consolidation below the $1.14 resistance, while an upside scenario would require a breakout above $1.14. If SUI falls below $0.92 support, a bearish continuation could materialize.
Last time, analysts noted that SUI traded in the mid-cap range with significant volatility, having experienced a sharp drawdown and weak momentum amid ongoing market pressure. Technical indicators point to continued high-beta behavior, with support levels forming near recent lows and sentiment closely linked to broader altcoin trends.


-
 Afghanistan
-
 Albania
-
 Algeria
-
 Angola
-
 Argentina
-
 Armenia
-
 Australia
-
 Austria
-
 Azerbaijan
-
 Bahamas
-
 Bahrain
-
 Bangladesh
-
 Belarus
-
 Belgium
-
 Bolivia
-
 Botswana
-
 Brazil
-
 Brunei
-
 Bulgaria
-
 Cambodia
-
 Cameroon
-
 Canada
-
 Chile
Chile
-
 China
China
-
 Colombia
-
 Congo
Congo
-
 Costa Rica
-
 Cote d'Ivoire
-
 Croatia
-
 Cuba
Cuba
-
 Cyprus
-
 Czechia
-
 DR Congo
-
 Denmark
-
 Dominican Republic
-
 Ecuador
-
 Egypt
Egypt
-
 El Salvador
-
 Estonia
-
 Eswatini
-
 Ethiopia
-
 Finland
-
 France
-
 Georgia
-
 Germany
-
 Ghana
Ghana
-
 Greece
-
 Haiti
Haiti
-
 Hong Kong
-
 Hungary
-
 India
India
-
 Indonesia
-
 Iran, Islamic republic
-
 Iraq
Iraq
-
 Ireland
-
 Israel
-
 Italy
Italy
-
 Jamaica
-
 Japan
Japan
-
 Jordan
-
 Kazakhstan
-
 Kenya
Kenya
-
 Korea
Korea
-
 Kuwait
-
 Kyrgyzstan
-
 Laos
Laos
-
 Latvia
-
 Lebanon
-
 Lesotho
-
 Libya
Libya
-
 Lithuania
-
 Luxembourg
-
 Madagascar
-
 Malaysia
-
 Malta
Malta
-
 Mauritius
-
 Mexico
-
 Moldova
-
 Mongolia
-
 Montenegro
-
 Morocco
-
 Mozambique
-
 Myanmar
-
 Namibia
-
 Nepal
Nepal
-
 Netherlands
-
 New Zealand
-
 Nigeria
-
 North Macedonia
-
 Norway
-
 Oman
Oman
-
 Pakistan
-
 Palestine
-
 Panama
-
 Papua New Guinea
-
 Paraguay
-
 Peru
Peru
-
 Philippines
-
 Poland
-
 Portugal
-
 Puerto Rico
-
 Qatar
Qatar
-
 Reunion
-
 Romania
-
 Rwanda
-
 Saudi Arabia
-
 Serbia
-
 Singapore
-
 Slovakia
-
 Slovenia
-
 Somalia
-
 South Africa
-
 Spain
Spain
-
 Sri Lanka
-
 Sweden
-
 Switzerland
-
 Syria
Syria
-
 Taiwan
-
 Tajikistan
-
 Tanzania
-
 Thailand
-
 Trinidad and Tobago
-
 Tunisia
-
 Turkey
-
 UAE
UAE
-
 Uganda
-
 Ukraine
-
 United Kingdom
-
United States
-
 Uruguay
-
 Uzbekistan
-
 Venezuela
-
 Vietnam
-
 Yemen
Yemen
-
 Zambia
-
 Zimbabwe
- Forex
- Crypto
