
DeXe: Bullish intraday momentum fuels 7.83% gain against broader downtrend

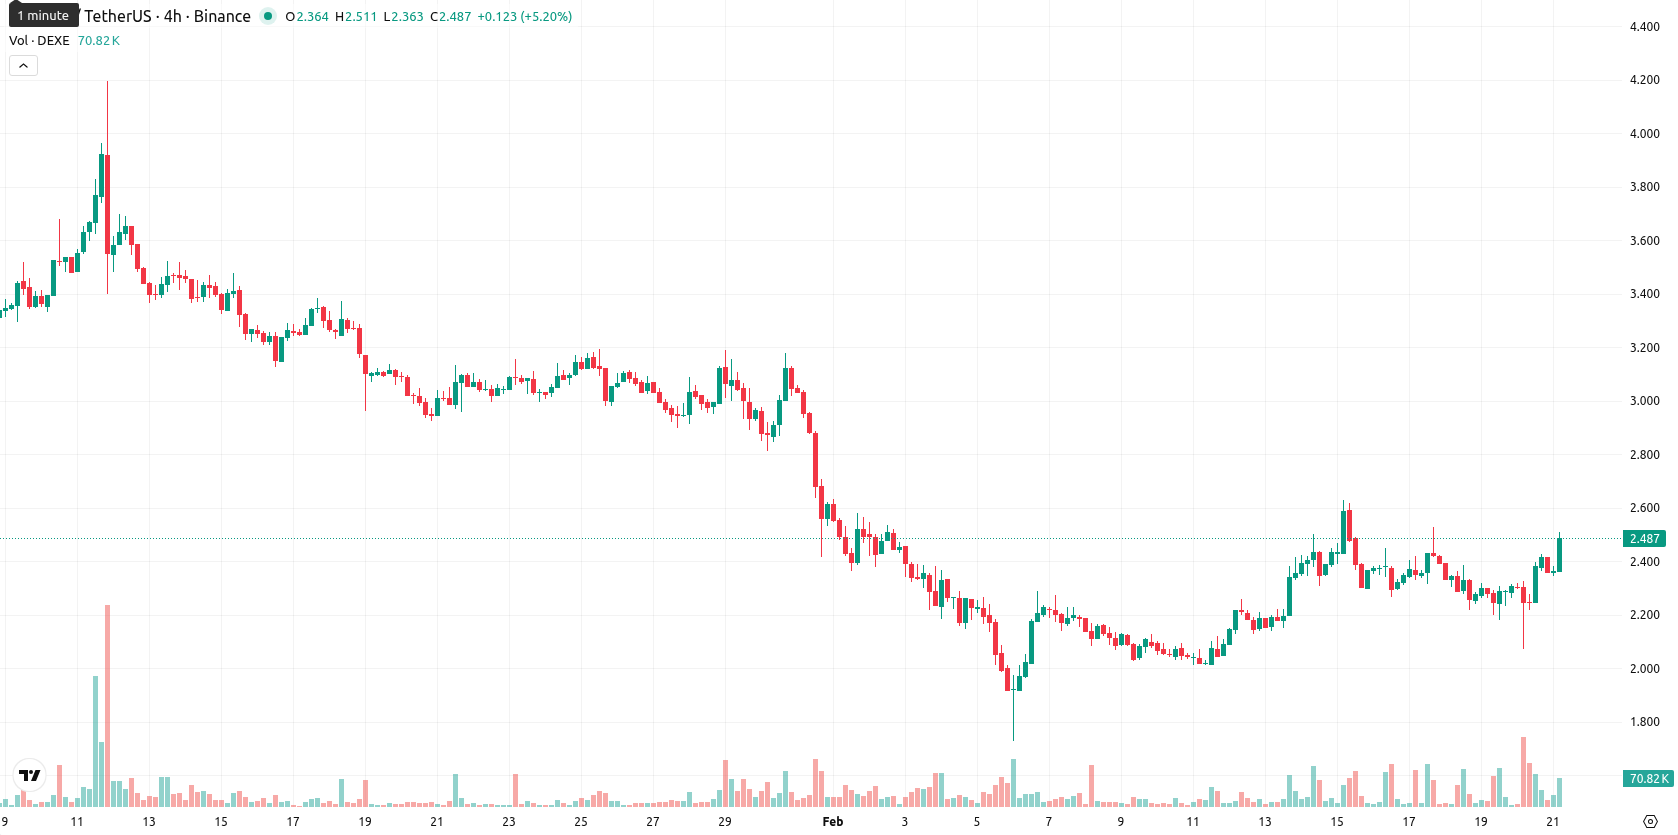
DeXe (DEXE) is trading above its MA-20 ($2.25) but remains below the MA-50 ($2.84) and MA-200 ($5.59), reflecting short-term strength within a broader downtrend. The Ichimoku Kijun at $2.46 currently acts as immediate support, as the price trades near today's high with notable intraday volatility.
Highlights
- DEXE is trading above its MA-20 ($2.25) but remains below both the MA-50 ($2.84) and MA-200 ($5.59), reflecting a short-term bounce in a broader downtrend.
- Momentum signals are mixed: the daily MACD is a strong sell while the ADX is neutral and the RSI is mildly bearish at 45.78, but intraday Bull Power shows buyers dominating.
- DEXE's likely trading range for the next five sessions is $2.20–$2.60, with a baseline expectation for sideways movement and less than 20% probability of a sustained breakout.
Mixed technical signals as overbought momentum clashes with bearish trend
DEXE’s technical backdrop is mixed: The MACD on the daily timeframe issues a strong sell, the ADX is neutral, and RSI stands at 45.78 (mildly bearish). The Stochastic RSI shows overbought conditions while the Commodity Channel Index remains neutral, signaling diverging short-term and overbought momentum. Bull/Bear Power suggests buyers are dominating today’s session, supported by a strong daily gain and a gap-up open. However, all major weekly indicators — Moving Averages, MACD, ADX, and RSI — are on a sell signal, underscoring persistent uncertainty in the broader trend.
Downside risk prevails as weekly technicals weaken bullish scenario
Over the next five sessions, DEXE is likely to trade within a typical volatility band of $2.20 to $2.60. A clear move above $2.60 would be required for a bullish breakout, but current technical momentum does not favor this scenario. The probability of a sustained rise above the upper band is below 20%, with the downside bias supported by weak weekly signals. Sideways movement between $2.20 and $2.60 remains the baseline scenario, with a potential bearish move beneath $2.20 if selling pressure returns.
Previously it was reported that DeXe is trading below key short-, medium-, and long-term moving averages, with technical indicators such as MACD, ADX, and RSI confirming persistent bearish momentum and seller dominance. Immediate resistance is identified at $2.46, and the asset is expected to remain under pressure within a sideways to downward trading range, absent a sustained move above this resistance level.


-
 Afghanistan
-
 Albania
-
 Algeria
-
 Angola
-
 Argentina
-
 Armenia
-
 Australia
-
 Austria
-
 Azerbaijan
-
 Bahamas
-
 Bahrain
-
 Bangladesh
-
 Belarus
-
 Belgium
-
 Bolivia
-
 Botswana
-
 Brazil
-
 Brunei
-
 Bulgaria
-
 Cambodia
-
 Cameroon
-
 Canada
-
 Chile
Chile
-
 China
China
-
 Colombia
-
 Congo
Congo
-
 Costa Rica
-
 Cote d'Ivoire
-
 Croatia
-
 Cuba
Cuba
-
 Cyprus
-
 Czechia
-
 DR Congo
-
 Denmark
-
 Dominican Republic
-
 Ecuador
-
 Egypt
Egypt
-
 El Salvador
-
 Estonia
-
 Eswatini
-
 Ethiopia
-
 Finland
-
 France
-
 Georgia
-
 Germany
-
 Ghana
Ghana
-
 Greece
-
 Haiti
Haiti
-
 Hong Kong
-
 Hungary
-
 India
India
-
 Indonesia
-
 Iran, Islamic republic
-
 Iraq
Iraq
-
 Ireland
-
 Israel
-
 Italy
Italy
-
 Jamaica
-
 Japan
Japan
-
 Jordan
-
 Kazakhstan
-
 Kenya
Kenya
-
 Korea
Korea
-
 Kuwait
-
 Kyrgyzstan
-
 Laos
Laos
-
 Latvia
-
 Lebanon
-
 Lesotho
-
 Libya
Libya
-
 Lithuania
-
 Luxembourg
-
 Madagascar
-
 Malaysia
-
 Malta
Malta
-
 Mauritius
-
 Mexico
-
 Moldova
-
 Mongolia
-
 Montenegro
-
 Morocco
-
 Mozambique
-
 Myanmar
-
 Namibia
-
 Nepal
Nepal
-
 Netherlands
-
 New Zealand
-
 Nigeria
-
 North Macedonia
-
 Norway
-
 Oman
Oman
-
 Pakistan
-
 Palestine
-
 Panama
-
 Papua New Guinea
-
 Paraguay
-
 Peru
Peru
-
 Philippines
-
 Poland
-
 Portugal
-
 Puerto Rico
-
 Qatar
Qatar
-
 Reunion
-
 Romania
-
 Rwanda
-
 Saudi Arabia
-
 Serbia
-
 Singapore
-
 Slovakia
-
 Slovenia
-
 Somalia
-
 South Africa
-
 Spain
Spain
-
 Sri Lanka
-
 Sweden
-
 Switzerland
-
 Syria
Syria
-
 Taiwan
-
 Tajikistan
-
 Tanzania
-
 Thailand
-
 Trinidad and Tobago
-
 Tunisia
-
 Turkey
-
 UAE
UAE
-
 Uganda
-
 Ukraine
-
 United Kingdom
-
United States
-
 Uruguay
-
 Uzbekistan
-
 Venezuela
-
 Vietnam
-
 Yemen
Yemen
-
 Zambia
-
 Zimbabwe
- Forex
- Crypto
