
Dogecoin drops 2.62% as price remains capped below MA-50 and bearish momentum persists – weekly outlook

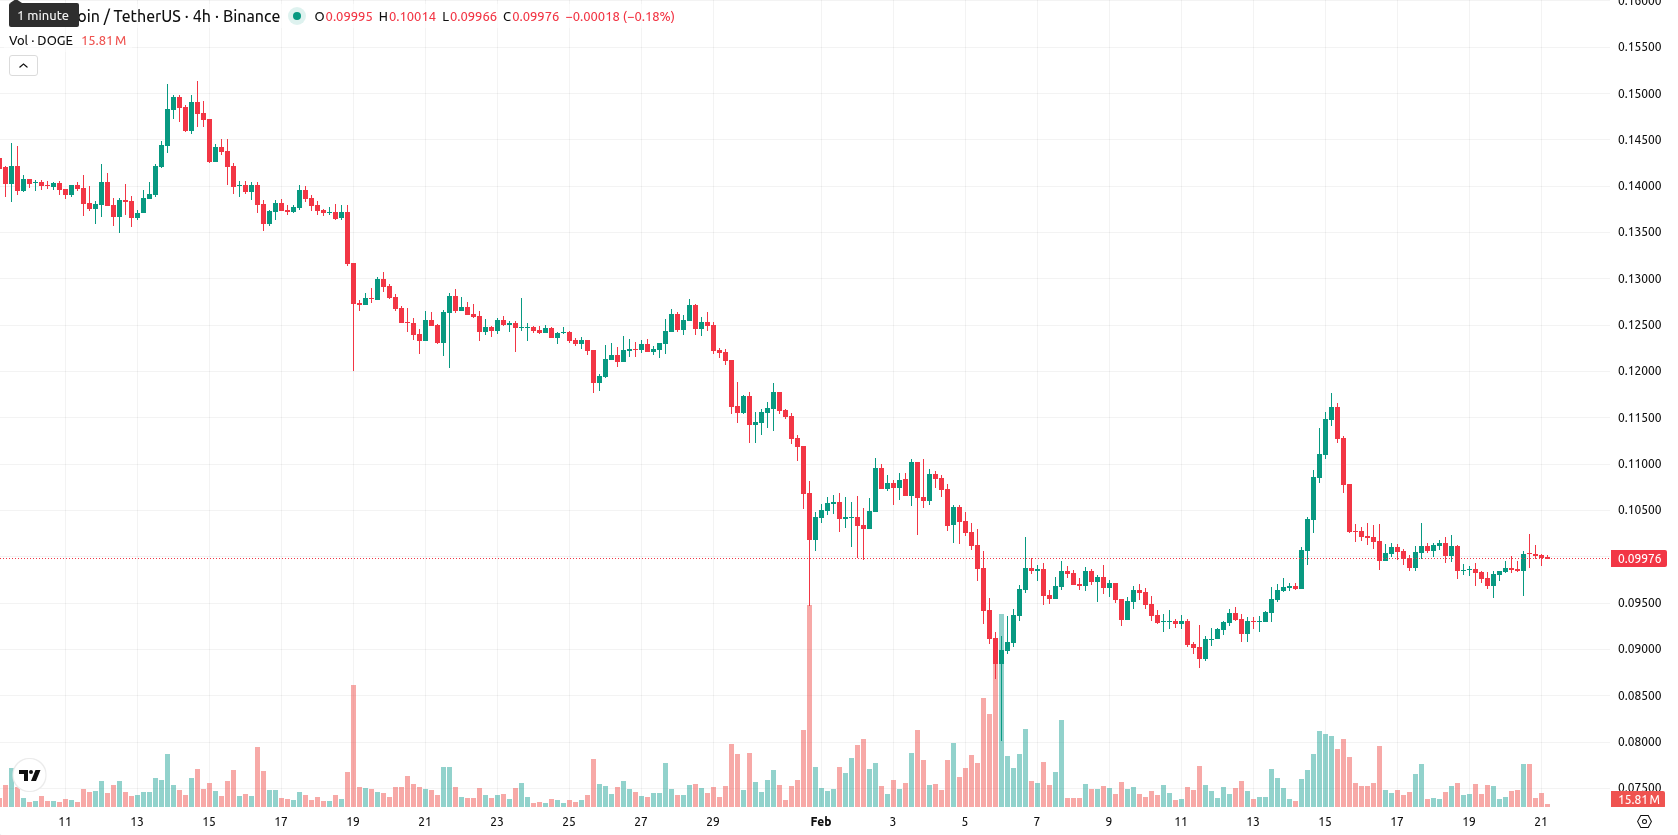
Dogecoin (DOGE) is trading at $0.09999, posting a modest weekly gain and closing just above its MA-20 at $0.09931. However, it remains well below its MA-50 at $0.11985 and MA-200 at $0.17533, signaling near-term stability but ongoing medium- and long-term bearish pressure on the weekly chart.
Highlights
- Dogecoin trades at $0.09999, just above its MA-20, but remains well below both the MA-50 at $0.11985 and MA-200 at $0.17533, signaling medium- to long-term bearish pressure.
- Momentum indicators are mixed: daily MACD and ADX show strong bearish trends, while Stochastic RSI above 60 suggests short-term recovery potential despite RSI remaining below 50.
- Dogecoin's immediate resistance is at $0.10388 (Ichimoku Kijun) and support at MA-20 ($0.09931); price is expected to consolidate between $0.0900 and $0.1100 over the next five trading days.
ETFs debut driving institutional interest but asset inflows remain limited this week
Several spot Dogecoin exchange-traded funds (ETFs), including products from 21Shares (TDOG), Grayscale (GDOG), and Bitwise (BWOW), launched in the United States during the past week. The 21Shares Dogecoin ETF, officially backed by the Dogecoin Foundation, began trading on Nasdaq on January 22, 2026, as a passive vehicle holding Dogecoin in institutional custody. Despite the regulatory approval and new investment options, total assets managed by these ETFs remain below $10 million, highlighting early-stage institutional engagement.
Mixed technical signals as weekly support holds amid persistent downward momentum
Technical analysis on the weekly timeframe shows DOGE hovering just above its MA-20, suggesting immediate support is holding. Stronger resistance levels are noted at the Ichimoku Kijun of $0.10388 and the MA-50 at $0.11985, with the MA-200 higher at $0.17533. Weekly RSI remains below 50, pointing to prevailing weakness, while MACD and ADX confirm ongoing bearish momentum. The weekly Stochastic RSI above 60 suggests some scope for minor recovery attempts, but oscillators are delivering mixed signals overall.
Range-bound outlook likely as bearish weekly indicators cap upside
For the upcoming week, DOGE is expected to remain range-bound between $0.0900 and $0.1100, reflecting typical levels of weekly volatility. The likelihood of a significant rally remains low, with persistent bearish momentum across weekly indicators favoring consolidation or modest declines. A bullish breakout would require a decisive move above the $0.104 resistance, potentially pushing toward $0.1100, while a sustained break below $0.0990 would signal further weakness, with support seen near $0.0900.
Previously it was reported that Dogecoin is trading lower and remains below key moving averages, with momentum indicators such as MACD and ADX confirming strong bearish pressure and weak support levels just below the current price. Technical signals—including neutral RSI, weak buyer presence, and a lack of oversold conditions—suggest continued downside risk as the asset holds near the lower end of its daily range amid heightened volatility.


-
 Afghanistan
-
 Albania
-
 Algeria
-
 Angola
-
 Argentina
-
 Armenia
-
 Australia
-
 Austria
-
 Azerbaijan
-
 Bahamas
-
 Bahrain
-
 Bangladesh
-
 Belarus
-
 Belgium
-
 Bolivia
-
 Botswana
-
 Brazil
-
 Brunei
-
 Bulgaria
-
 Cambodia
-
 Cameroon
-
 Canada
-
 Chile
Chile
-
 China
China
-
 Colombia
-
 Congo
Congo
-
 Costa Rica
-
 Cote d'Ivoire
-
 Croatia
-
 Cuba
Cuba
-
 Cyprus
-
 Czechia
-
 DR Congo
-
 Denmark
-
 Dominican Republic
-
 Ecuador
-
 Egypt
Egypt
-
 El Salvador
-
 Estonia
-
 Eswatini
-
 Ethiopia
-
 Finland
-
 France
-
 Georgia
-
 Germany
-
 Ghana
Ghana
-
 Greece
-
 Haiti
Haiti
-
 Hong Kong
-
 Hungary
-
 India
India
-
 Indonesia
-
 Iran, Islamic republic
-
 Iraq
Iraq
-
 Ireland
-
 Israel
-
 Italy
Italy
-
 Jamaica
-
 Japan
Japan
-
 Jordan
-
 Kazakhstan
-
 Kenya
Kenya
-
 Korea
Korea
-
 Kuwait
-
 Kyrgyzstan
-
 Laos
Laos
-
 Latvia
-
 Lebanon
-
 Lesotho
-
 Libya
Libya
-
 Lithuania
-
 Luxembourg
-
 Madagascar
-
 Malaysia
-
 Malta
Malta
-
 Mauritius
-
 Mexico
-
 Moldova
-
 Mongolia
-
 Montenegro
-
 Morocco
-
 Mozambique
-
 Myanmar
-
 Namibia
-
 Nepal
Nepal
-
 Netherlands
-
 New Zealand
-
 Nigeria
-
 North Macedonia
-
 Norway
-
 Oman
Oman
-
 Pakistan
-
 Palestine
-
 Panama
-
 Papua New Guinea
-
 Paraguay
-
 Peru
Peru
-
 Philippines
-
 Poland
-
 Portugal
-
 Puerto Rico
-
 Qatar
Qatar
-
 Reunion
-
 Romania
-
 Rwanda
-
 Saudi Arabia
-
 Serbia
-
 Singapore
-
 Slovakia
-
 Slovenia
-
 Somalia
-
 South Africa
-
 Spain
Spain
-
 Sri Lanka
-
 Sweden
-
 Switzerland
-
 Syria
Syria
-
 Taiwan
-
 Tajikistan
-
 Tanzania
-
 Thailand
-
 Trinidad and Tobago
-
 Tunisia
-
 Turkey
-
 UAE
UAE
-
 Uganda
-
 Ukraine
-
 United Kingdom
-
United States
-
 Uruguay
-
 Uzbekistan
-
 Venezuela
-
 Vietnam
-
 Yemen
Yemen
-
 Zambia
-
 Zimbabwe
- Forex
- Crypto
