
Ethena falls as technical indicators point to continued seller control

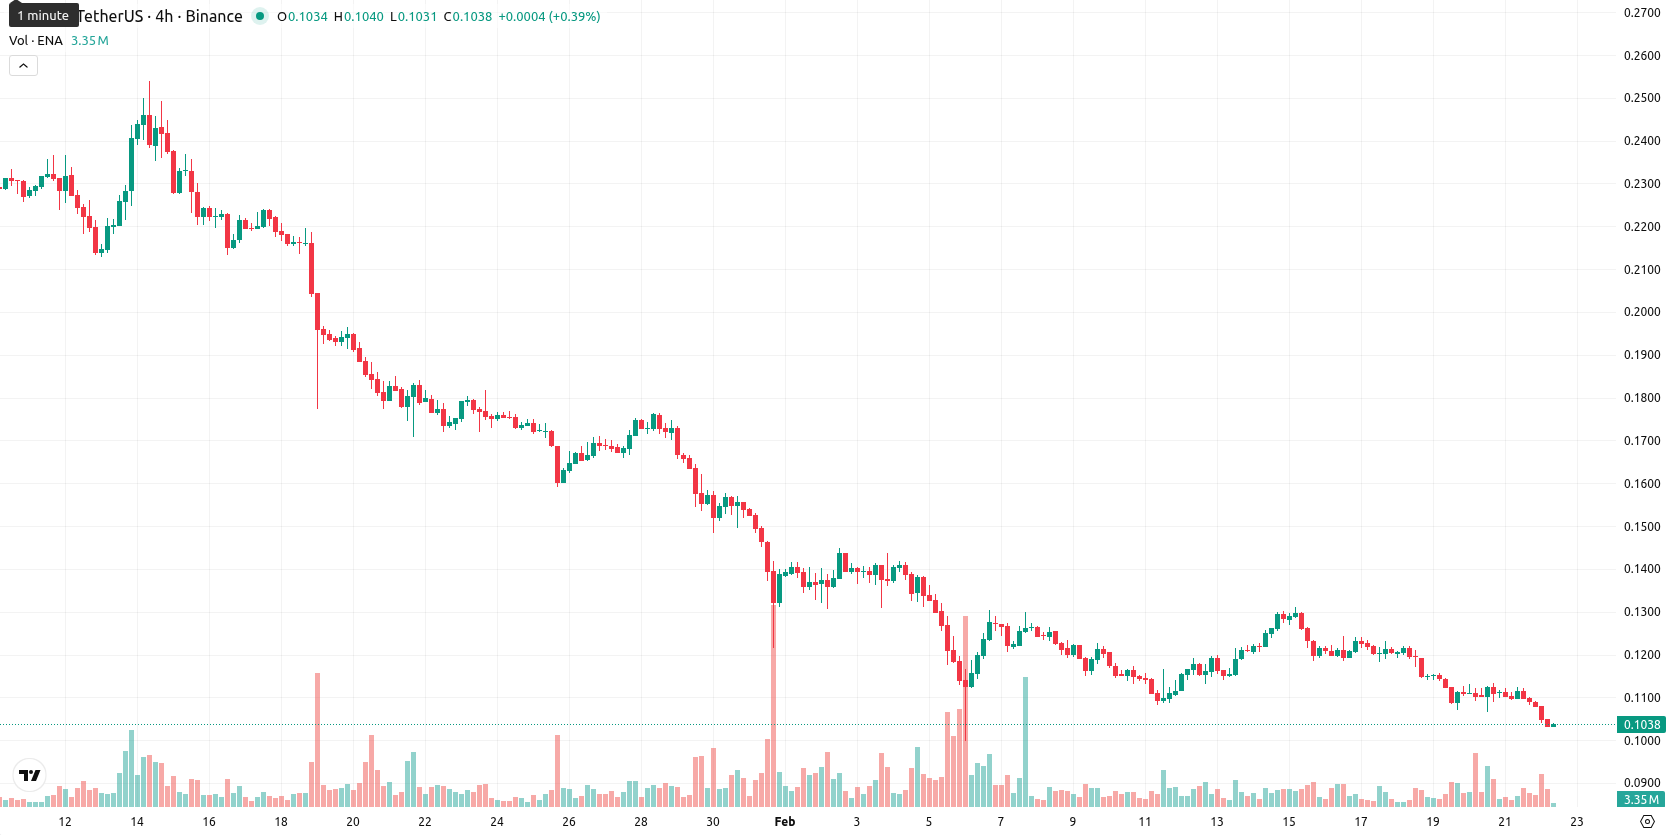
Ethena (ENA) is trading at $0.1039 after declining 7.15% today, with price action trending below its MA-20 ($0.1212), MA-50 ($0.1698), and MA-200 ($0.3917), indicating persistent downward pressure across all timeframes.
Highlights
- ENA is trading at $0.1039, below its MA-20 ($0.1212), MA-50 ($0.1698), and MA-200 ($0.3917), indicating sustained seller pressure across all timeframes.
- Momentum and oscillators remain strongly bearish, with the MACD and elevated ADX confirming a prevailing downtrend, while RSI and CCI highlight oversold conditions.
- Immediate resistance is at $0.1381 (Ichimoku Kijun), support is at $0.094, with a high likelihood of continued declines and a low probability (<20%) of a rebound.
Negative momentum intensifies amid resistance near oversold signals
The technical landscape for ENA remains negative, with all major moving averages situated well above current price levels. Immediate resistance is defined by the Ichimoku Kijun at $0.1381, while principal support is found near $0.094. Bearish momentum is reinforced with the MACD continuing to signal strong sell, the ADX at high levels, and both daily and weekly RSI readings (30.60 and 32.13) approaching oversold territory. The Commodity Channel Index and Bull/Bear Power confirm seller dominance, while the Awesome Oscillator is currently neutral and the Stochastic RSI signals oversold conditions on higher timeframes.
Downside risk prevails with low odds of bullish reversal
In the short term, ENA is expected to fluctuate within a volatility band of $0.094 to $0.114, anchored around the current level due to high intraday volatility and persistent negative momentum. The likelihood of a sustained price increase is low, with further declines more probable as bearish signals persist across weekly indicators. The base expectation is for ENA to remain capped between immediate resistance at $0.1381 and support at $0.094. A break above resistance could trigger a bullish move, while a close below support would expose the asset to additional downside risk.
Last time, analysts noted that Ethena is trading under persistent bearish pressure, remaining below all major moving averages with a negative MACD, high ADX, and RSI/CCI readings near oversold territory. The asset continues to face strong resistance at the $0.1383 Kijun level, with elevated volatility and limited support indicating a strong likelihood of further declines or sideways consolidation in the near term.


Latest Ethena News


-
 Afghanistan
-
 Albania
-
 Algeria
-
 Angola
-
 Argentina
-
 Armenia
-
 Australia
-
 Austria
-
 Azerbaijan
-
 Bahamas
-
 Bahrain
-
 Bangladesh
-
 Belarus
-
 Belgium
-
 Bolivia
-
 Botswana
-
 Brazil
-
 Brunei
-
 Bulgaria
-
 Cambodia
-
 Cameroon
-
 Canada
-
 Chile
Chile
-
 China
China
-
 Colombia
-
 Congo
Congo
-
 Costa Rica
-
 Cote d'Ivoire
-
 Croatia
-
 Cuba
Cuba
-
 Cyprus
-
 Czechia
-
 DR Congo
-
 Denmark
-
 Dominican Republic
-
 Ecuador
-
 Egypt
Egypt
-
 El Salvador
-
 Estonia
-
 Eswatini
-
 Ethiopia
-
 Finland
-
 France
-
 Georgia
-
 Germany
-
 Ghana
Ghana
-
 Greece
-
 Haiti
Haiti
-
 Hong Kong
-
 Hungary
-
 India
India
-
 Indonesia
-
 Iran, Islamic republic
-
 Iraq
Iraq
-
 Ireland
-
 Israel
-
 Italy
Italy
-
 Jamaica
-
 Japan
Japan
-
 Jordan
-
 Kazakhstan
-
 Kenya
Kenya
-
 Korea
Korea
-
 Kuwait
-
 Kyrgyzstan
-
 Laos
Laos
-
 Latvia
-
 Lebanon
-
 Lesotho
-
 Libya
Libya
-
 Lithuania
-
 Luxembourg
-
 Madagascar
-
 Malaysia
-
 Malta
Malta
-
 Mauritius
-
 Mexico
-
 Moldova
-
 Mongolia
-
 Montenegro
-
 Morocco
-
 Mozambique
-
 Myanmar
-
 Namibia
-
 Nepal
Nepal
-
 Netherlands
-
 New Zealand
-
 Nigeria
-
 North Macedonia
-
 Norway
-
 Oman
Oman
-
 Pakistan
-
 Palestine
-
 Panama
-
 Papua New Guinea
-
 Paraguay
-
 Peru
Peru
-
 Philippines
-
 Poland
-
 Portugal
-
 Puerto Rico
-
 Qatar
Qatar
-
 Reunion
-
 Romania
-
 Rwanda
-
 Saudi Arabia
-
 Serbia
-
 Singapore
-
 Slovakia
-
 Slovenia
-
 Somalia
-
 South Africa
-
 Spain
Spain
-
 Sri Lanka
-
 Sweden
-
 Switzerland
-
 Syria
Syria
-
 Taiwan
-
 Tajikistan
-
 Tanzania
-
 Thailand
-
 Trinidad and Tobago
-
 Tunisia
-
 Turkey
-
 UAE
UAE
-
 Uganda
-
 Ukraine
-
 United Kingdom
-
United States
-
 Uruguay
-
 Uzbekistan
-
 Venezuela
-
 Vietnam
-
 Yemen
Yemen
-
 Zambia
-
 Zimbabwe
- Forex
- Crypto
