
Litecoin remains under pressure amid weekly losses and mixed momentum signals despite institutional ETF interest – weekly analysis

Litecoin (LTC) is currently trading at $54.09, just below its 20-week moving average at $54.93 and well beneath the 50-week moving average at $65.95 and the 200-week moving average at $91.47. Over the past week, LTC declined by $1.10, or 2%, underscoring continued weakness below all major weekly trend lines.
 47.82
48.28
47.82
48.28
Highlights
- LTC trades at $54.09, sitting below its MA-20 ($54.93), MA-50 ($65.95), and MA-200 ($91.47), indicating firm bearish momentum across all timeframes.
- Momentum indicators signal sustained seller dominance: daily MACD shows a strong sell, ADX is high, with a 1.99% daily price drop highlighting selling pressure.
- Key support is near $51.50, while resistance stands at $57.78; probability of a price increase next week is below 20%, favoring further declines or sideways action.
Institutional adoption strengthens as new ETF filings and collateral options emerge
Litecoin received notable institutional recognition as T. Rowe Price filed for an Active Crypto ETF featuring LTC as a core holding, signaling increased adoption by traditional financial institutions. Coinbase expanded its loan program to accept LTC as collateral via Morpho, enhancing utility and accessibility for the asset. Trading volume over the past day reached $313.24 million, and market capitalization stands at $4.21 billion, highlighting robust ecosystem activity.
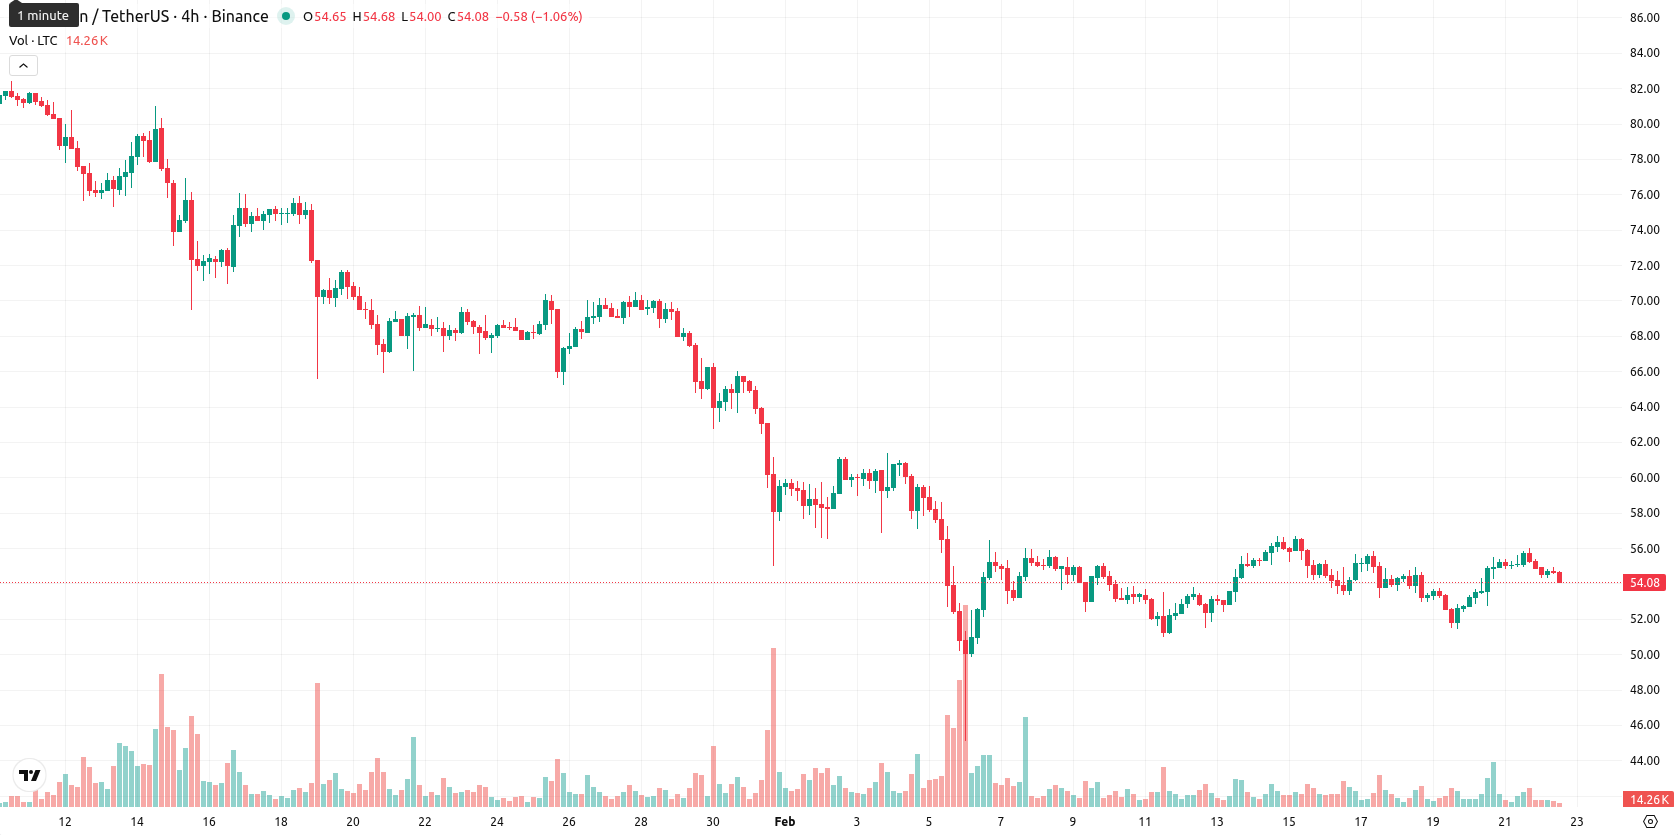
Bearish momentum persists this week amid mixed oversold signals and technical resistance
Weekly technical signals remain firmly bearish, with LTC positioned below the MA-20, MA-50, and MA-200, and dynamic resistance from the Ichimoku Kijun at $57.78. The weekly chart shows immediate support at recent intraday lows, while momentum indicators paint a mixed picture: a strong MACD sell signal, high ADX reflecting persistent negative trend strength, and RSI and CCI pointing to mild oversold conditions. The Stochastic RSI is overbought, suggesting potential for volatility or corrective moves, and Bull/Bear Power confirms a prevailing bias toward sellers.
Range-bound outlook expected as breakout risk stays low in the coming week
Over the next five to seven trading days, LTC is likely to move within a range of $51.50 to $56.50, reflecting the current bearish weekly setup. There is less than a 20% probability of a significant upward move, so continued pressure or sideway trading is expected. A breakout above $57.78 would be required to shift to a more bullish outlook, while a weekly close below $51.50 could trigger further declines toward new multi-month lows.
Previously it was reported that Litecoin currently trades in the mid-cap range with pronounced volatility and sustained underperformance relative to Bitcoin and large-cap peers. Technicals reflect ongoing weakness, with price action tracking broad crypto liquidity cycles, while key indicators to monitor include exchange liquidity, major support levels near recent lows, and whether Litecoin can regain positive momentum relative to its moving averages.









-
 Afghanistan
-
 Albania
-
 Algeria
-
 Angola
-
 Argentina
-
 Armenia
-
 Australia
-
 Austria
-
 Azerbaijan
-
 Bahamas
-
 Bahrain
-
 Bangladesh
-
 Belarus
-
 Belgium
-
 Bolivia
-
 Botswana
-
 Brazil
-
 Brunei
-
 Bulgaria
-
 Cambodia
-
 Cameroon
-
 Canada
-
 Chile
Chile
-
 China
China
-
 Colombia
-
 Congo
Congo
-
 Costa Rica
-
 Cote d'Ivoire
-
 Croatia
-
 Cuba
Cuba
-
 Cyprus
-
 Czechia
-
 DR Congo
-
 Denmark
-
 Dominican Republic
-
 Ecuador
-
 Egypt
Egypt
-
 El Salvador
-
 Estonia
-
 Eswatini
-
 Ethiopia
-
 Finland
-
 France
-
 Georgia
-
 Germany
-
 Ghana
Ghana
-
 Greece
-
 Haiti
Haiti
-
 Hong Kong
-
 Hungary
-
 India
India
-
 Indonesia
-
 Iran, Islamic republic
-
 Iraq
Iraq
-
 Ireland
-
 Israel
-
 Italy
Italy
-
 Jamaica
-
 Japan
Japan
-
 Jordan
-
 Kazakhstan
-
 Kenya
Kenya
-
 Korea
Korea
-
 Kuwait
-
 Kyrgyzstan
-
 Laos
Laos
-
 Latvia
-
 Lebanon
-
 Lesotho
-
 Libya
Libya
-
 Lithuania
-
 Luxembourg
-
 Madagascar
-
 Malaysia
-
 Malta
Malta
-
 Mauritius
-
 Mexico
-
 Moldova
-
 Mongolia
-
 Montenegro
-
 Morocco
-
 Mozambique
-
 Myanmar
-
 Namibia
-
 Nepal
Nepal
-
 Netherlands
-
 New Zealand
-
 Nigeria
-
 North Macedonia
-
 Norway
-
 Oman
Oman
-
 Pakistan
-
 Palestine
-
 Panama
-
 Papua New Guinea
-
 Paraguay
-
 Peru
Peru
-
 Philippines
-
 Poland
-
 Portugal
-
 Puerto Rico
-
 Qatar
Qatar
-
 Reunion
-
 Romania
-
 Rwanda
-
 Saudi Arabia
-
 Serbia
-
 Singapore
-
 Slovakia
-
 Slovenia
-
 Somalia
-
 South Africa
-
 Spain
Spain
-
 Sri Lanka
-
 Sweden
-
 Switzerland
-
 Syria
Syria
-
 Taiwan
-
 Tajikistan
-
 Tanzania
-
 Thailand
-
 Trinidad and Tobago
-
 Tunisia
-
 Turkey
-
 UAE
UAE
-
 Uganda
-
 Ukraine
-
 United Kingdom
-
United States
-
 Uruguay
-
 Uzbekistan
-
 Venezuela
-
 Vietnam
-
 Yemen
Yemen
-
 Zambia
-
 Zimbabwe
- Forex
- Crypto












