
XLM slides as technicals remain weak, with resistance at $0.1580 and support clustering near $0.1440 – weekly forecast

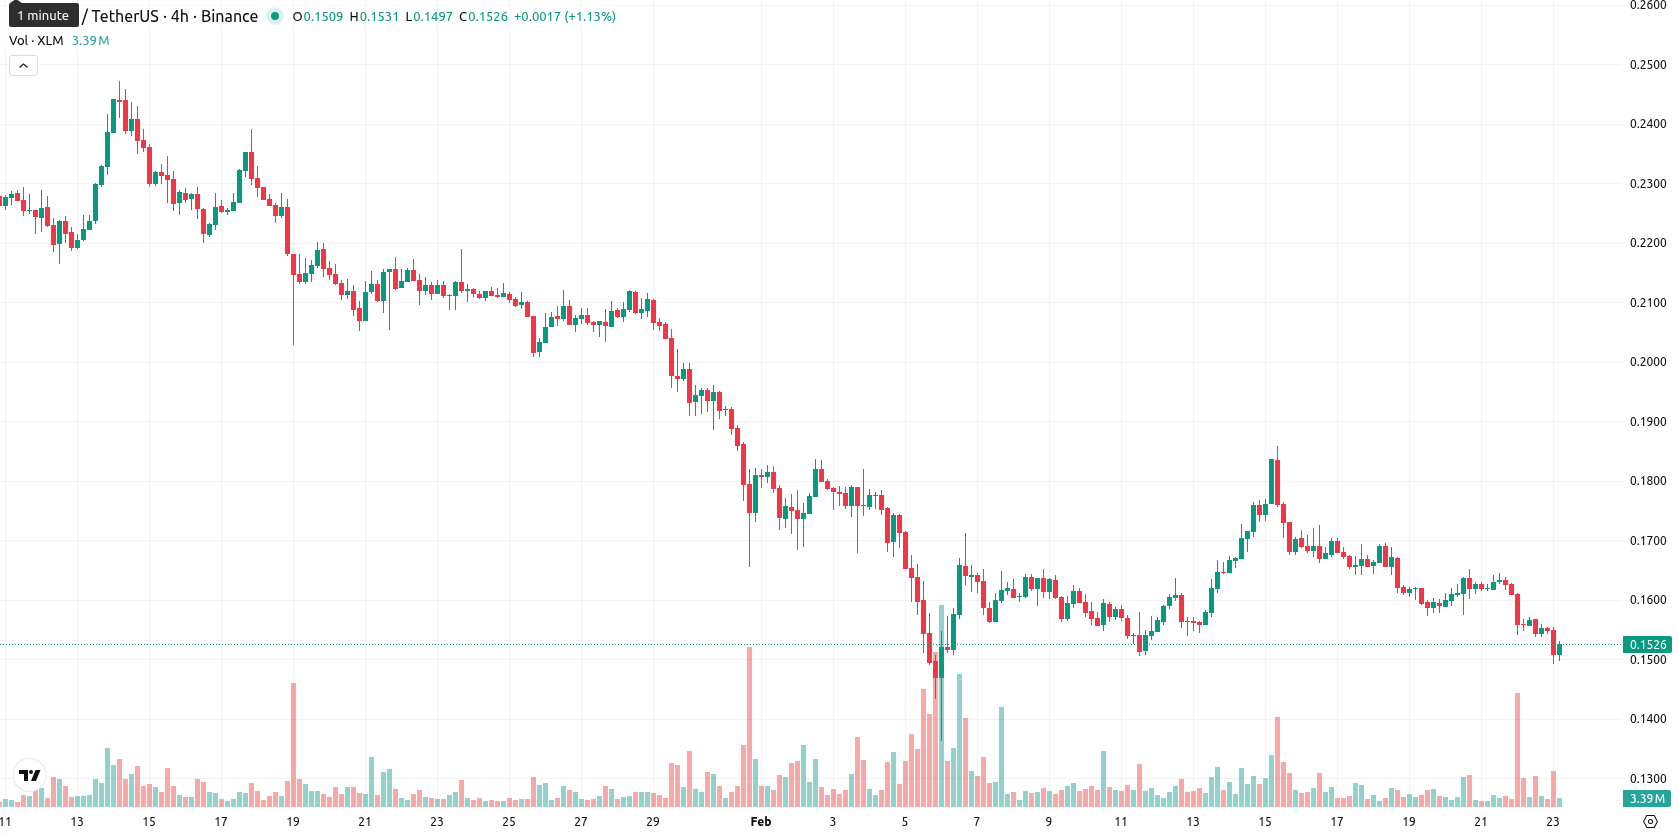
Stellar (XLM) closed the week at $0.1529, marking a decline over the last seven days. The asset continues to trade below its W1 MA-20 ($0.1627), MA-50 ($0.1950), and MA-200 ($0.2877), signaling persistent bearish pressure across all major weekly moving averages.
Highlights
- XLM's price at $0.1529 is trading below the MA-20 ($0.1627), MA-50 ($0.1950), and MA-200 ($0.2877), indicating multi-timeframe downside pressure.
- Momentum indicators including MACD, ADX, RSI (35.88), and CCI (–81.23) confirm sustained bearish sentiment, with the market approaching, but not at, oversold conditions.
- For the next five trading days, XLM is likely to range between $0.1440 support and $0.1580 resistance, with less than 20% probability of price increase.
Weak momentum confirmed over the week as technicals stay bearish
On the weekly chart, XLM remains well below the major moving averages, reinforcing the established downtrend. The nearest dynamic resistance is the Ichimoku Kijun at $0.1742, while support levels are clustered near the lower end of recent weekly ranges, with $0.1440 acting as a short-term floor. Weekly RSI sits at 35.88, not yet in extreme oversold territory, but well below the midpoint, confirming weak momentum. Other momentum indicators, including MACD and ADX, point to sustained selling pressure, with a lack of positive divergence in oscillators to suggest imminent reversal.
Range-bound outlook for next week as downside risk dominates
For the upcoming week, XLM is likely to consolidate in a tight range between $0.1440 and $0.1580, in line with the prevailing bearish technical structure. Downside pressure is expected to dominate, with less than a 20% probability of a bullish breakout. Should XLM decisively clear resistance at $0.1580 — $0.1600, a subsequent advance toward the Ichimoku Kijun near $0.1742 becomes possible. Conversely, a break below $0.1440 would expose XLM to fresh lows, with technicals signaling more downside risk.
Last time, analysts noted that Stellar was consolidating beneath long-term resistance, with the price oscillating between key support at $0.160 and resistance near $0.175 while the 20- and 50-period EMAs tracked closely to price and the 200 EMA served as structural resistance. Technical indicators such as a neutral RSI in the low to mid-40s and moderate volume suggested range-bound positioning without decisive bullish or bearish momentum.


Latest Stellar News


-
 Afghanistan
-
 Albania
-
 Algeria
-
 Angola
-
 Argentina
-
 Armenia
-
 Australia
-
 Austria
-
 Azerbaijan
-
 Bahamas
-
 Bahrain
-
 Bangladesh
-
 Belarus
-
 Belgium
-
 Bolivia
-
 Botswana
-
 Brazil
-
 Brunei
-
 Bulgaria
-
 Cambodia
-
 Cameroon
-
 Canada
-
 Chile
Chile
-
 China
China
-
 Colombia
-
 Congo
Congo
-
 Costa Rica
-
 Cote d'Ivoire
-
 Croatia
-
 Cuba
Cuba
-
 Cyprus
-
 Czechia
-
 DR Congo
-
 Denmark
-
 Dominican Republic
-
 Ecuador
-
 Egypt
Egypt
-
 El Salvador
-
 Estonia
-
 Eswatini
-
 Ethiopia
-
 Finland
-
 France
-
 Georgia
-
 Germany
-
 Ghana
Ghana
-
 Greece
-
 Haiti
Haiti
-
 Hong Kong
-
 Hungary
-
 India
India
-
 Indonesia
-
 Iran, Islamic republic
-
 Iraq
Iraq
-
 Ireland
-
 Israel
-
 Italy
Italy
-
 Jamaica
-
 Japan
Japan
-
 Jordan
-
 Kazakhstan
-
 Kenya
Kenya
-
 Korea
Korea
-
 Kuwait
-
 Kyrgyzstan
-
 Laos
Laos
-
 Latvia
-
 Lebanon
-
 Lesotho
-
 Libya
Libya
-
 Lithuania
-
 Luxembourg
-
 Madagascar
-
 Malaysia
-
 Malta
Malta
-
 Mauritius
-
 Mexico
-
 Moldova
-
 Mongolia
-
 Montenegro
-
 Morocco
-
 Mozambique
-
 Myanmar
-
 Namibia
-
 Nepal
Nepal
-
 Netherlands
-
 New Zealand
-
 Nigeria
-
 North Macedonia
-
 Norway
-
 Oman
Oman
-
 Pakistan
-
 Palestine
-
 Panama
-
 Papua New Guinea
-
 Paraguay
-
 Peru
Peru
-
 Philippines
-
 Poland
-
 Portugal
-
 Puerto Rico
-
 Qatar
Qatar
-
 Reunion
-
 Romania
-
 Rwanda
-
 Saudi Arabia
-
 Serbia
-
 Singapore
-
 Slovakia
-
 Slovenia
-
 Somalia
-
 South Africa
-
 Spain
Spain
-
 Sri Lanka
-
 Sweden
-
 Switzerland
-
 Syria
Syria
-
 Taiwan
-
 Tajikistan
-
 Tanzania
-
 Thailand
-
 Trinidad and Tobago
-
 Tunisia
-
 Turkey
-
 UAE
UAE
-
 Uganda
-
 Ukraine
-
 United Kingdom
-
United States
-
 Uruguay
-
 Uzbekistan
-
 Venezuela
-
 Vietnam
-
 Yemen
Yemen
-
 Zambia
-
 Zimbabwe
- Forex
- Crypto
