
Chainlink price prediction: Can bullish bounce continue? LINK up 7.45%

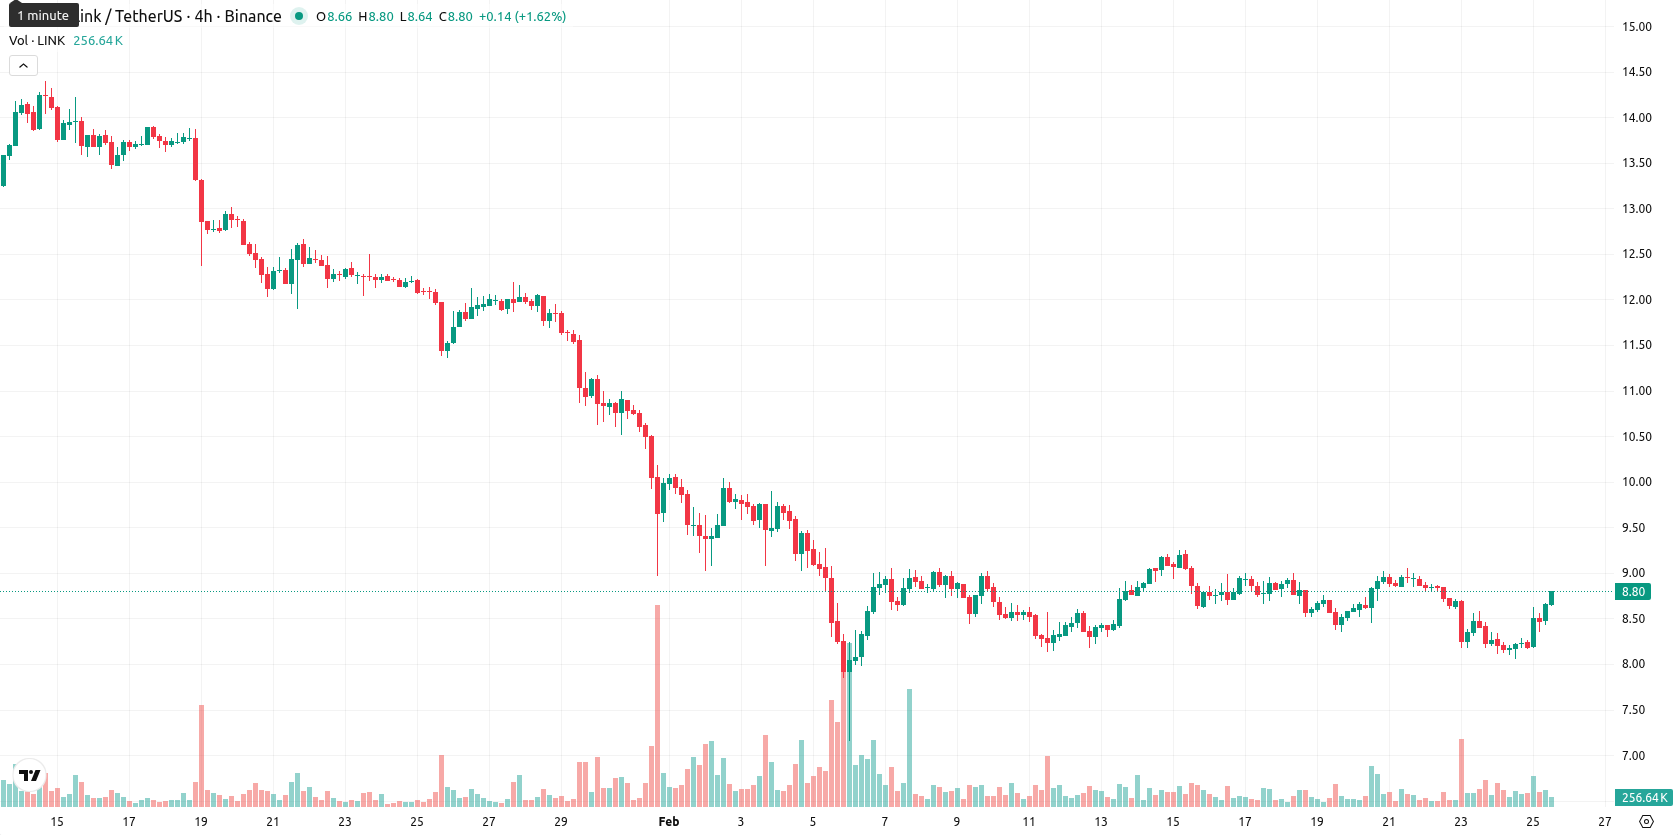
Chainlink (LINK) is trading at $8.76, sitting slightly above its 20-day Moving Average ($8.66) but well below the 50-day ($10.81) and 200-day ($16.34) levels, which signals a short-term consolidation within a firmly bearish medium- and long-term structure. The Ichimoku Kijun on D1 stands at $9.16, placing immediate resistance just overhead.
Highlights
- Taylor Lindman, former Deputy General Counsel at Chainlink Labs, started as Chief Counsel for the SEC’s Crypto Task Force on February 23, 2026.
- Chainlink Labs is prioritizing expansion of blockchain-based cross-border payments in the UK to drive institutional adoption of tokenized assets via its oracle network.
- LINK trades at $8.76, consolidating above the 20-day MA ($8.66) but below the 50- and 200-day MAs, with near-term range seen at $7.80–$9.20.
Leadership shift and UK focus as regulatory priorities evolve
Taylor Lindman, who served as Deputy General Counsel at Chainlink Labs for five years, began his new role as Chief Counsel for the U.S. Securities and Exchange Commission’s Crypto Task Force on February 23, 2026, following his involvement in regulatory meetings and token taxonomy discussions. Chainlink Labs expressed appreciation for his contributions and confirmed his departure. The company is also focusing on expanding blockchain-based cross-border payments in the UK to facilitate institutional adoption of tokenized assets through its oracle infrastructure.
Seller dominance endures amid high volatility and overbought reversal risks
Momentum signals remain negative as both MACD and ADX on D1 indicate persistent seller control. RSI and the Commodity Channel Index both print oversold signals—RSI at 33.99 and CCI at -150.47—while Bull/Bear Power at -0.37 highlights ongoing seller dominance on the day. Despite neutral-to-oversold readings from Stochastic RSI and Awesome Oscillator, LINK advanced 7.45% today ($0.61 higher), gapping higher at the open with the price reaching the top of today's range ($8.76 of $8.18 – $8.76). Intraday volatility is high, and today's action shows robust strength toward the daily high and a firm upside tone, though momentum and oscillator divergences underscore the risk of a technical pullback.
Probability favors further losses as LINK faces range-bound pressure
For the next five trading days, the expected range for LINK is $7.80 – $9.20, representing a typical volatility band relative to current levels. There is a very low probability—less than 20%—of a meaningful price increase, making further declines more likely in the near term. Baseline scenario: LINK consolidates between $7.80 and $9.20 as sellers and buyers test support and resistance. Bullish scenario: a break above $9.16 sparks a recovery toward the upper band of the range, while failure to hold $7.80 may trigger accelerated losses toward lower weekly support.
Last time, analysts noted that Chainlink (LINK) had gained 7.13%, approaching the key resistance level at $10.24 amid strengthening bullish momentum. Technical indicators suggest buyers are testing this resistance, while maintaining support near recent lows; moving averages and momentum oscillators point to a positive short-term trend.


-
 Afghanistan
-
 Albania
-
 Algeria
-
 Angola
-
 Argentina
-
 Armenia
-
 Australia
-
 Austria
-
 Azerbaijan
-
 Bahamas
-
 Bahrain
-
 Bangladesh
-
 Belarus
-
 Belgium
-
 Bolivia
-
 Botswana
-
 Brazil
-
 Brunei
-
 Bulgaria
-
 Cambodia
-
 Cameroon
-
 Canada
-
 Chile
Chile
-
 China
China
-
 Colombia
-
 Congo
Congo
-
 Costa Rica
-
 Cote d'Ivoire
-
 Croatia
-
 Cuba
Cuba
-
 Cyprus
-
 Czechia
-
 DR Congo
-
 Denmark
-
 Dominican Republic
-
 Ecuador
-
 Egypt
Egypt
-
 El Salvador
-
 Estonia
-
 Eswatini
-
 Ethiopia
-
 Finland
-
 France
-
 Georgia
-
 Germany
-
 Ghana
Ghana
-
 Greece
-
 Haiti
Haiti
-
 Hong Kong
-
 Hungary
-
 India
India
-
 Indonesia
-
 Iran, Islamic republic
-
 Iraq
Iraq
-
 Ireland
-
 Israel
-
 Italy
Italy
-
 Jamaica
-
 Japan
Japan
-
 Jordan
-
 Kazakhstan
-
 Kenya
Kenya
-
 Korea
Korea
-
 Kuwait
-
 Kyrgyzstan
-
 Laos
Laos
-
 Latvia
-
 Lebanon
-
 Lesotho
-
 Libya
Libya
-
 Lithuania
-
 Luxembourg
-
 Madagascar
-
 Malaysia
-
 Malta
Malta
-
 Mauritius
-
 Mexico
-
 Moldova
-
 Mongolia
-
 Montenegro
-
 Morocco
-
 Mozambique
-
 Myanmar
-
 Namibia
-
 Nepal
Nepal
-
 Netherlands
-
 New Zealand
-
 Nigeria
-
 North Macedonia
-
 Norway
-
 Oman
Oman
-
 Pakistan
-
 Palestine
-
 Panama
-
 Papua New Guinea
-
 Paraguay
-
 Peru
Peru
-
 Philippines
-
 Poland
-
 Portugal
-
 Puerto Rico
-
 Qatar
Qatar
-
 Reunion
-
 Romania
-
 Rwanda
-
 Saudi Arabia
-
 Serbia
-
 Singapore
-
 Slovakia
-
 Slovenia
-
 Somalia
-
 South Africa
-
 Spain
Spain
-
 Sri Lanka
-
 Sweden
-
 Switzerland
-
 Syria
Syria
-
 Taiwan
-
 Tajikistan
-
 Tanzania
-
 Thailand
-
 Trinidad and Tobago
-
 Tunisia
-
 Turkey
-
 UAE
UAE
-
 Uganda
-
 Ukraine
-
 United Kingdom
-
United States
-
 Uruguay
-
 Uzbekistan
-
 Venezuela
-
 Vietnam
-
 Yemen
Yemen
-
 Zambia
-
 Zimbabwe
- Forex
- Crypto
