
Onchain Cloud launch and network recovery — Filecoin gains 12.05%

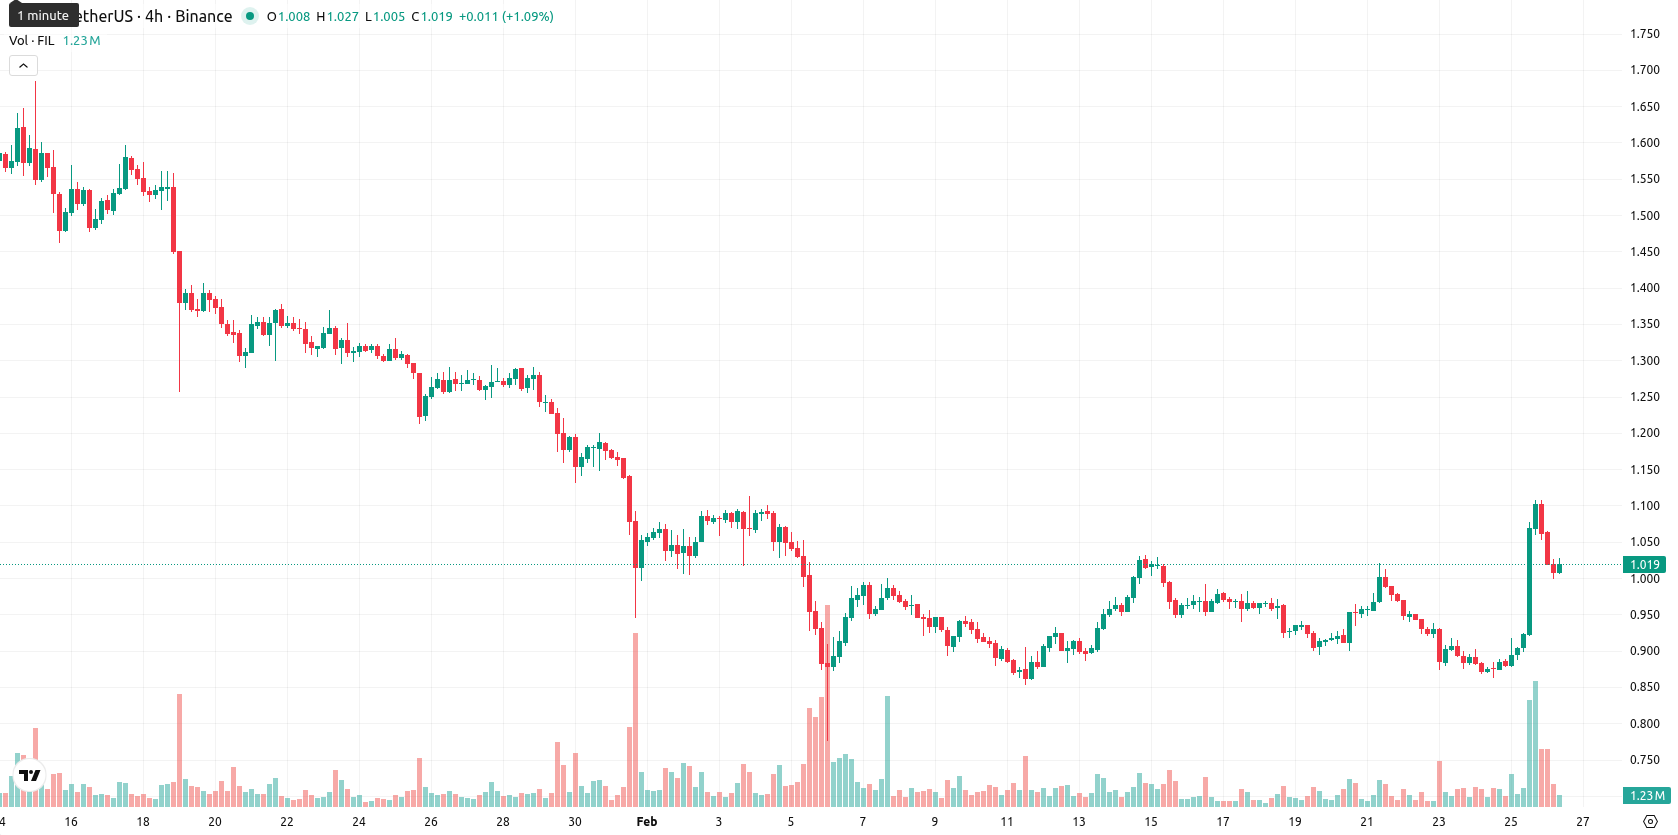
Filecoin (FIL) is trading at $1.023, gaining 12.05% intraday, and currently sits above the MA-20 at $0.9474500 but below both the MA-50 at $1.1730000 and MA-200 at $1.7412650. This reflects positive short-term momentum, while medium- and long-term trends still favor sellers, with the Ichimoku Kijun at $0.9765000 offering initial support below.
Highlights
- Filecoin launched its Onchain Cloud platform in November 2025, evolving beyond decentralized storage to a programmable, verifiable cloud solution with on-chain settlement for compute and payments.
- The Filecoin Foundation's 2025 Annual Report detailed major network upgrades, ecosystem funding, and governance progress, boosting network open interest and market capitalization after a recent recovery.
- Filecoin trades at $1.023, above MA-20 ($0.9474500) but below MA-50 ($1.1730000) and MA-200 ($1.7412650), with immediate support at $0.9765000 and high short-term volatility indicating risk of pullback.
Open interest and ecosystem upgrades drive post-recovery sentiment shift
Filecoin recently launched its Onchain Cloud platform in November 2025, enhancing the network from a decentralized storage protocol to a programmable, verifiable cloud solution with on-chain settlement for storage, retrieval, compute, and payments. The Filecoin Foundation also published its 2025 Annual Report detailing major network upgrades, ecosystem funding, governance, and security initiatives, and outlined progress toward seamless integration and product-market fit. Trading activity was further influenced by the network's increased open interest and market capitalization growth following the platform's recent low and recovery.
Mixed momentum and overbought signals raise correction risk
Momentum indicators present a mixed outlook for FIL. The daily MACD indicates strong selling pressure, while the ADX reflects a downtrend marked by heightened activity. Stochastic RSI and Commodity Channel Index both register overbought levels, suggesting a correction risk, even as daily RSI stays at moderately bullish values. Bull/Bear Power shows intraday buyer dominance, matching the session's price spike and persistence near session highs. Price action remains volatile, with positive intraday sentiment, but the divergence between momentum and overbought oscillators increases near-term pullback risks.
Low odds for breakout as weak weekly trend caps upside
For the coming week, FIL is expected to trade within a $0.92 to $1.12 volatility band relative to current levels. Given weak readings from weekly trend indicators, the likelihood of sustained gains remains below 20%, with sideways trading as the baseline scenario. A close above $1.12 would signal a shift in momentum and open the path to further gains, while a failure to hold $0.92 support could trigger a deeper retracement due to the presence of strong longer-term resistance.
Previously it was reported that Filecoin is exhibiting short-term bullish momentum with its price above the 20-day moving average but remains under medium- and long-term selling pressure, facing resistance at higher moving averages and the psychological $1.10–$1.17 zone. Key technical indicators—including mixed RSI, bearish MACD, weakening ADX, and overbought oscillator signals—highlight increased caution and rising downside risk despite renewed ecosystem interest and high intraday volatility.


Latest Filecoin News


-
 Afghanistan
-
 Albania
-
 Algeria
-
 Angola
-
 Argentina
-
 Armenia
-
 Australia
-
 Austria
-
 Azerbaijan
-
 Bahamas
-
 Bahrain
-
 Bangladesh
-
 Belarus
-
 Belgium
-
 Bolivia
-
 Botswana
-
 Brazil
-
 Brunei
-
 Bulgaria
-
 Cambodia
-
 Cameroon
-
 Canada
-
 Chile
Chile
-
 China
China
-
 Colombia
-
 Congo
Congo
-
 Costa Rica
-
 Cote d'Ivoire
-
 Croatia
-
 Cuba
Cuba
-
 Cyprus
-
 Czechia
-
 DR Congo
-
 Denmark
-
 Dominican Republic
-
 Ecuador
-
 Egypt
Egypt
-
 El Salvador
-
 Estonia
-
 Eswatini
-
 Ethiopia
-
 Finland
-
 France
-
 Georgia
-
 Germany
-
 Ghana
Ghana
-
 Greece
-
 Haiti
Haiti
-
 Hong Kong
-
 Hungary
-
 India
India
-
 Indonesia
-
 Iran, Islamic republic
-
 Iraq
Iraq
-
 Ireland
-
 Israel
-
 Italy
Italy
-
 Jamaica
-
 Japan
Japan
-
 Jordan
-
 Kazakhstan
-
 Kenya
Kenya
-
 Korea
Korea
-
 Kuwait
-
 Kyrgyzstan
-
 Laos
Laos
-
 Latvia
-
 Lebanon
-
 Lesotho
-
 Libya
Libya
-
 Lithuania
-
 Luxembourg
-
 Madagascar
-
 Malaysia
-
 Malta
Malta
-
 Mauritius
-
 Mexico
-
 Moldova
-
 Mongolia
-
 Montenegro
-
 Morocco
-
 Mozambique
-
 Myanmar
-
 Namibia
-
 Nepal
Nepal
-
 Netherlands
-
 New Zealand
-
 Nigeria
-
 North Macedonia
-
 Norway
-
 Oman
Oman
-
 Pakistan
-
 Palestine
-
 Panama
-
 Papua New Guinea
-
 Paraguay
-
 Peru
Peru
-
 Philippines
-
 Poland
-
 Portugal
-
 Puerto Rico
-
 Qatar
Qatar
-
 Reunion
-
 Romania
-
 Rwanda
-
 Saudi Arabia
-
 Serbia
-
 Singapore
-
 Slovakia
-
 Slovenia
-
 Somalia
-
 South Africa
-
 Spain
Spain
-
 Sri Lanka
-
 Sweden
-
 Switzerland
-
 Syria
Syria
-
 Taiwan
-
 Tajikistan
-
 Tanzania
-
 Thailand
-
 Trinidad and Tobago
-
 Tunisia
-
 Turkey
-
 UAE
UAE
-
 Uganda
-
 Ukraine
-
 United Kingdom
-
United States
-
 Uruguay
-
 Uzbekistan
-
 Venezuela
-
 Vietnam
-
 Yemen
Yemen
-
 Zambia
-
 Zimbabwe
- Forex
- Crypto
