
NEAR: Bullish bias counters sell signals, price gains 11.82% amid volatility

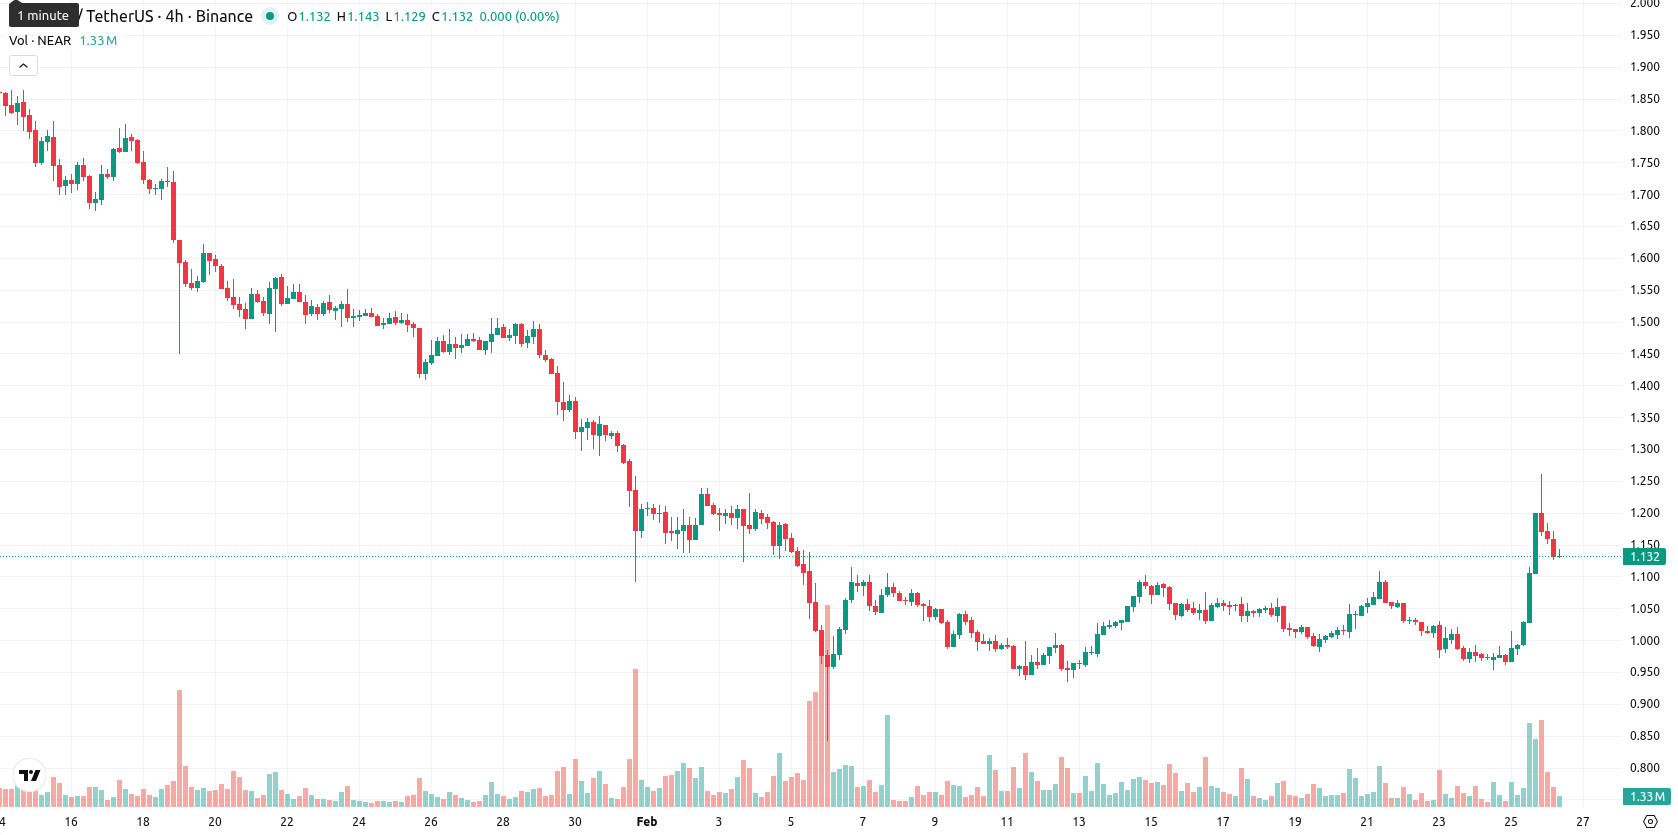
NEAR (NEAR) is trading at $1.135, having gained 11.82% on the day. The asset is positioned above its MA-20 ($1.0352), below the MA-50 ($1.3200), and remains well under the MA-200 ($2.0406), signaling short-term bullish momentum even as medium- and long-term bearish trends persist.
Highlights
- NEAR trades at $1.135, above its MA-20 ($1.0352) but below longer-term MAs, signaling short-term upside within a broader bearish trend.
- Intraday momentum remains mixed: Bull/Bear Power is positive, but MACD shows strong selling, and overbought oscillators suggest a high risk of near-term pullbacks.
- Expect NEAR to consolidate between $1.05 and $1.20 over the next five days, with less than 20% probability of a sustained breakout above $1.20.
Mixed momentum signals prompt caution amid overbought conditions
Technical indicators present a mixed picture for NEAR. The Ichimoku Kijun sits at $1.0850, acting as immediate support. Momentum is divided: the daily MACD signals strong selling and the ADX shows a robust bearish trend, while the daily RSI registers a mild bullish bias at 54.66. Stochastic RSI and CCI suggest overbought conditions, increasing risk of a short-term pullback, though intraday Bull/Bear Power remains positive. The opening gap from $1.015 to $1.178 and current trading activity near the midpoint of today’s volatile range ($1.1267 – $1.184) highlight ongoing consolidation after early strength, but overbought oscillators and divergent signals warrant caution.
Sideways outlook expected as bearish factors curb breakout odds
Over the next five trading days, NEAR is likely to fluctuate between $1.05 and $1.20, reflecting typical volatility bands relative to current levels. A further rise has a low probability (less than 20%), as persistent bearish signals from the weekly moving averages, MACD, and RSI dominate the broader outlook. The baseline scenario sees the asset consolidating sideways between $1.05 and $1.20. A bullish breakout above $1.20 could drive prices higher toward previous resistance, but this is an unlikely outcome, while a drop below $1.05 may lead to more pronounced selling given the prevailing long-term downward momentum.
Previously it was reported that NEAR Protocol trades above its 20-day moving average, indicating positive short-term momentum, but remains below the 50-day and 200-day averages, reflecting ongoing medium- and long-term selling pressure. Key indicators show mixed momentum, with resistance near $1.20 and technical signals such as MACD and overbought oscillators suggesting elevated volatility and risk of a near-term pullback despite recent buyer activity.


Latest NEAR News


-
 Afghanistan
-
 Albania
-
 Algeria
-
 Angola
-
 Argentina
-
 Armenia
-
 Australia
-
 Austria
-
 Azerbaijan
-
 Bahamas
-
 Bahrain
-
 Bangladesh
-
 Belarus
-
 Belgium
-
 Bolivia
-
 Botswana
-
 Brazil
-
 Brunei
-
 Bulgaria
-
 Cambodia
-
 Cameroon
-
 Canada
-
 Chile
Chile
-
 China
China
-
 Colombia
-
 Congo
Congo
-
 Costa Rica
-
 Cote d'Ivoire
-
 Croatia
-
 Cuba
Cuba
-
 Cyprus
-
 Czechia
-
 DR Congo
-
 Denmark
-
 Dominican Republic
-
 Ecuador
-
 Egypt
Egypt
-
 El Salvador
-
 Estonia
-
 Eswatini
-
 Ethiopia
-
 Finland
-
 France
-
 Georgia
-
 Germany
-
 Ghana
Ghana
-
 Greece
-
 Haiti
Haiti
-
 Hong Kong
-
 Hungary
-
 India
India
-
 Indonesia
-
 Iran, Islamic republic
-
 Iraq
Iraq
-
 Ireland
-
 Israel
-
 Italy
Italy
-
 Jamaica
-
 Japan
Japan
-
 Jordan
-
 Kazakhstan
-
 Kenya
Kenya
-
 Korea
Korea
-
 Kuwait
-
 Kyrgyzstan
-
 Laos
Laos
-
 Latvia
-
 Lebanon
-
 Lesotho
-
 Libya
Libya
-
 Lithuania
-
 Luxembourg
-
 Madagascar
-
 Malaysia
-
 Malta
Malta
-
 Mauritius
-
 Mexico
-
 Moldova
-
 Mongolia
-
 Montenegro
-
 Morocco
-
 Mozambique
-
 Myanmar
-
 Namibia
-
 Nepal
Nepal
-
 Netherlands
-
 New Zealand
-
 Nigeria
-
 North Macedonia
-
 Norway
-
 Oman
Oman
-
 Pakistan
-
 Palestine
-
 Panama
-
 Papua New Guinea
-
 Paraguay
-
 Peru
Peru
-
 Philippines
-
 Poland
-
 Portugal
-
 Puerto Rico
-
 Qatar
Qatar
-
 Reunion
-
 Romania
-
 Rwanda
-
 Saudi Arabia
-
 Serbia
-
 Singapore
-
 Slovakia
-
 Slovenia
-
 Somalia
-
 South Africa
-
 Spain
Spain
-
 Sri Lanka
-
 Sweden
-
 Switzerland
-
 Syria
Syria
-
 Taiwan
-
 Tajikistan
-
 Tanzania
-
 Thailand
-
 Trinidad and Tobago
-
 Tunisia
-
 Turkey
-
 UAE
UAE
-
 Uganda
-
 Ukraine
-
 United Kingdom
-
United States
-
 Uruguay
-
 Uzbekistan
-
 Venezuela
-
 Vietnam
-
 Yemen
Yemen
-
 Zambia
-
 Zimbabwe
- Forex
- Crypto
