
Theta falls 7.28% as price slips below key moving averages

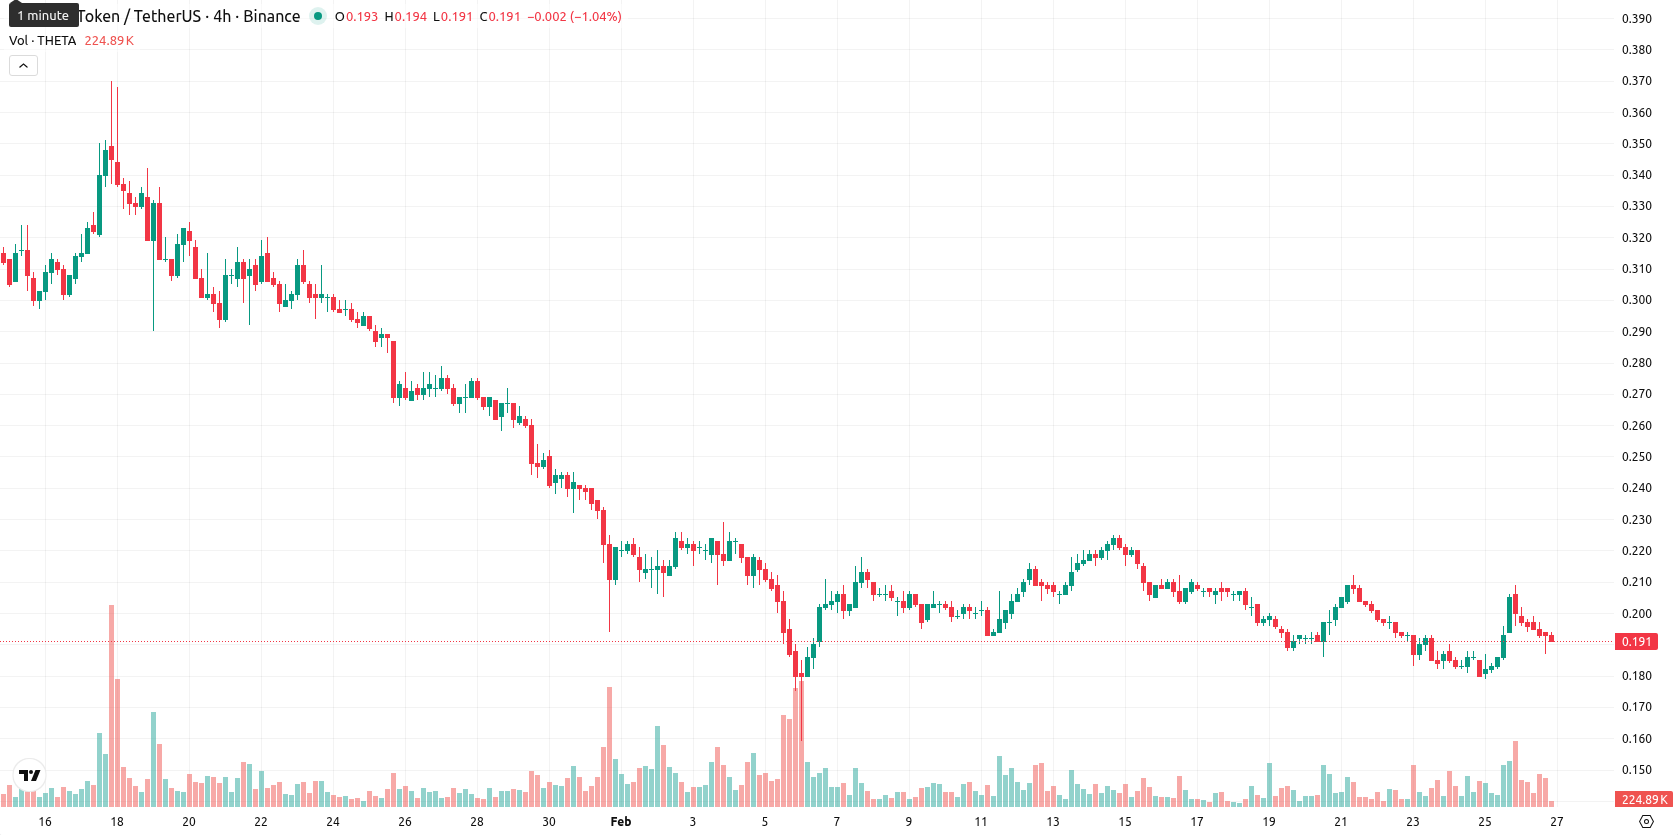
Theta (THETA) is currently trading at $0.191, down 7.28% for the day. The asset is positioned below its MA-20 ($0.2026), MA-50 ($0.2485), and MA-200 ($0.4812), indicating sustained selling pressure in the short, medium, and long term.
Highlights
- THETA is trading at $0.191, below its MA-20 ($0.2026), MA-50 ($0.2485), and MA-200 ($0.4812), underscoring sustained bearish momentum across all timeframes.
- Key technical oscillators—MACD and ADX—indicate strong selling pressure, with intraday price falling 7.28% and trading near session lows amid increased volatility.
- Immediate resistance is at $0.2000 (Ichimoku Kijun); the probable range for the next 5 days is $0.155–$0.220, with sub-20% probability of a short-term rebound.
Divergent oscillator signals as resistance limits upside moves
THETA faces immediate resistance at the Ichimoku Kijun level of $0.2000. The MACD remains firmly negative, indicating a strong sell, and the ADX supports the prevailing bearish trend. Neither the RSI nor the CCI shows oversold conditions, while the Stochastic RSI is flagged as overbought, creating a divergence among oscillators. Bull/Bear Power delivers a strong buy signal, but the Awesome Oscillator remains neutral, confirming mixed signals and indecision within the momentum setup.
Sideways bias persists as breakout risks remain low
For the next five trading days, the expected price range is set at $0.155 to $0.220, reflecting a typical volatility band relative to current levels. The chance of a short-term price increase is less than 20%, suggesting a continued likelihood of further decline. The base scenario anticipates sideways movement between $0.155 and $0.220, a bullish scenario would require a breakout above $0.200, and a bearish case could see a move below $0.155 if selling pressure intensifies.
Previously it was reported that Theta Network (THETA) is trading just above its 20-day moving average and the Ichimoku kijun, indicating short-term buyer activity, but remains well below the 50-day and 200-day moving averages, underlining a prevailing bearish trend. Technical indicators present a mixed picture, with momentum gauges like MACD and ADX signaling continued bearishness, while oversold readings from RSI and Stoch RSI suggest seller exhaustion and elevated short-term volatility near key support and resistance levels.


Latest Theta News


-
 Afghanistan
-
 Albania
-
 Algeria
-
 Angola
-
 Argentina
-
 Armenia
-
 Australia
-
 Austria
-
 Azerbaijan
-
 Bahamas
-
 Bahrain
-
 Bangladesh
-
 Belarus
-
 Belgium
-
 Bolivia
-
 Botswana
-
 Brazil
-
 Brunei
-
 Bulgaria
-
 Cambodia
-
 Cameroon
-
 Canada
-
 Chile
Chile
-
 China
China
-
 Colombia
-
 Congo
Congo
-
 Costa Rica
-
 Cote d'Ivoire
-
 Croatia
-
 Cuba
Cuba
-
 Cyprus
-
 Czechia
-
 DR Congo
-
 Denmark
-
 Dominican Republic
-
 Ecuador
-
 Egypt
Egypt
-
 El Salvador
-
 Estonia
-
 Eswatini
-
 Ethiopia
-
 Finland
-
 France
-
 Georgia
-
 Germany
-
 Ghana
Ghana
-
 Greece
-
 Haiti
Haiti
-
 Hong Kong
-
 Hungary
-
 India
India
-
 Indonesia
-
 Iran, Islamic republic
-
 Iraq
Iraq
-
 Ireland
-
 Israel
-
 Italy
Italy
-
 Jamaica
-
 Japan
Japan
-
 Jordan
-
 Kazakhstan
-
 Kenya
Kenya
-
 Korea
Korea
-
 Kuwait
-
 Kyrgyzstan
-
 Laos
Laos
-
 Latvia
-
 Lebanon
-
 Lesotho
-
 Libya
Libya
-
 Lithuania
-
 Luxembourg
-
 Madagascar
-
 Malaysia
-
 Malta
Malta
-
 Mauritius
-
 Mexico
-
 Moldova
-
 Mongolia
-
 Montenegro
-
 Morocco
-
 Mozambique
-
 Myanmar
-
 Namibia
-
 Nepal
Nepal
-
 Netherlands
-
 New Zealand
-
 Nigeria
-
 North Macedonia
-
 Norway
-
 Oman
Oman
-
 Pakistan
-
 Palestine
-
 Panama
-
 Papua New Guinea
-
 Paraguay
-
 Peru
Peru
-
 Philippines
-
 Poland
-
 Portugal
-
 Puerto Rico
-
 Qatar
Qatar
-
 Reunion
-
 Romania
-
 Rwanda
-
 Saudi Arabia
-
 Serbia
-
 Singapore
-
 Slovakia
-
 Slovenia
-
 Somalia
-
 South Africa
-
 Spain
Spain
-
 Sri Lanka
-
 Sweden
-
 Switzerland
-
 Syria
Syria
-
 Taiwan
-
 Tajikistan
-
 Tanzania
-
 Thailand
-
 Trinidad and Tobago
-
 Tunisia
-
 Turkey
-
 UAE
UAE
-
 Uganda
-
 Ukraine
-
 United Kingdom
-
United States
-
 Uruguay
-
 Uzbekistan
-
 Venezuela
-
 Vietnam
-
 Yemen
Yemen
-
 Zambia
-
 Zimbabwe
- Forex
- Crypto
