
-7.21% for Jupiter — Bearish momentum and tight resistance define trading action

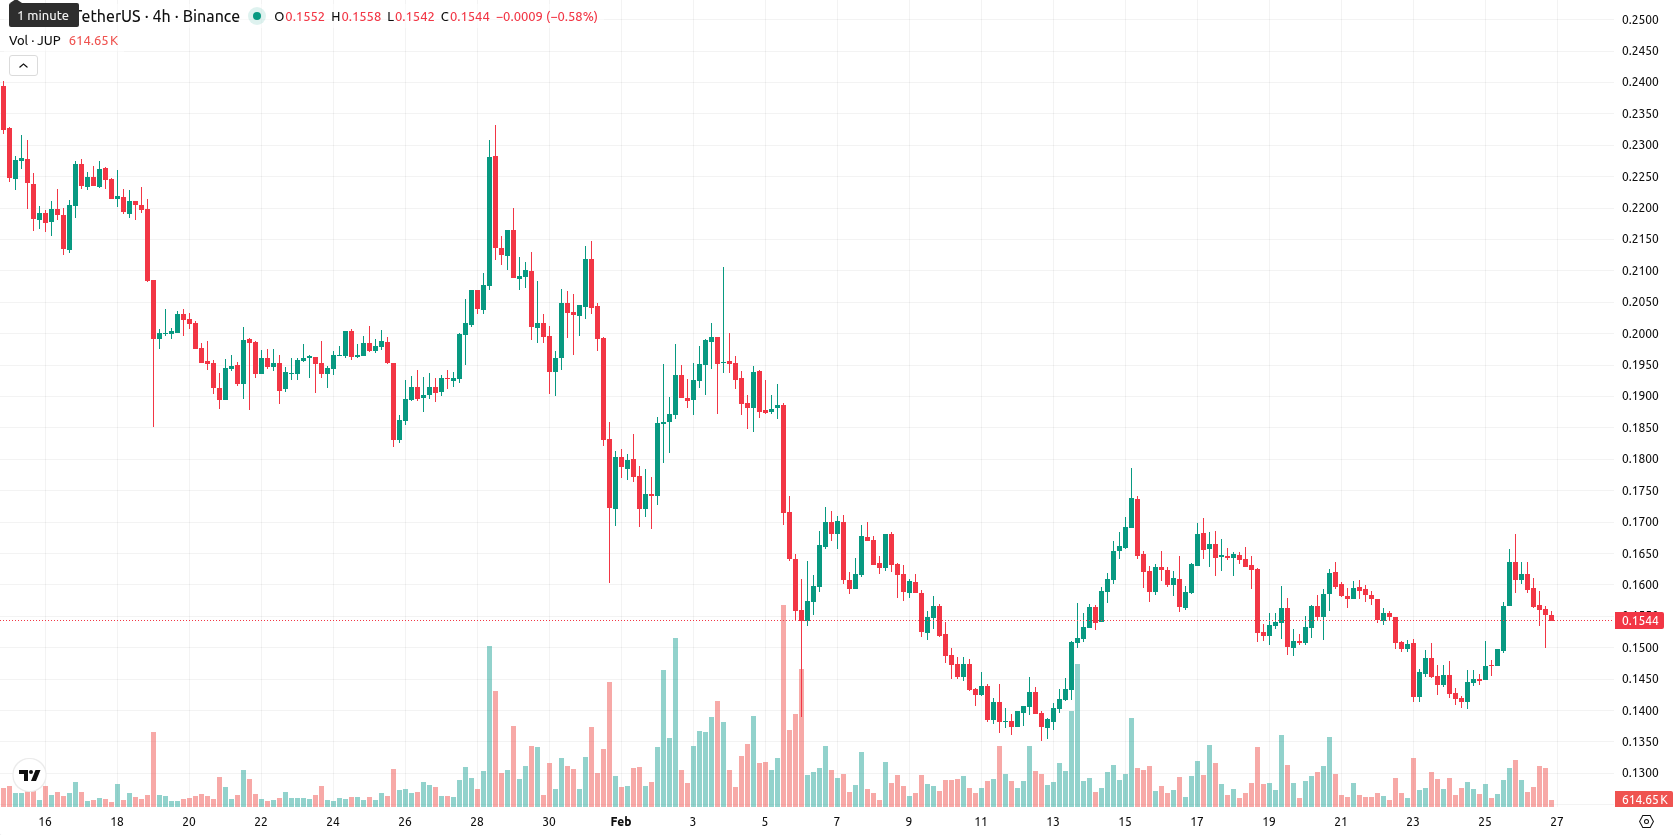
Jupiter (JUP) is currently trading at $0.1544, just beneath the MA-20 ($0.1548) and well below the MA-50 ($0.1833) and MA-200 ($0.3218), indicating short-term sideways bias but pronounced medium- and long-term downside pressure. The Ichimoku Kijun on D1 stands at $0.1748, serving as immediate resistance for the current session.
Highlights
- Jupiter suspended its JUP token release ahead of a $317 million token unlock across multiple DeFi protocols in late February to manage liquidity and volatility.
- Jupiter continues to innovate with features like limit orders and dollar-cost averaging on Solana, though overall price action remains under broad selling pressure.
- JUP trades at $0.1544 below key moving averages, with resistance at $0.1748 and a probable trading range of $0.1400–$0.1690 over the next five days.
Liquidity management drives JUP token unlock delay amid DeFi event
Jupiter halted its upcoming JUP token release as it prepares for a major $317 million token unlock event involving multiple DeFi protocols in late February. This move was made to manage liquidity and limit short-term volatility, aligning with industry trends toward controlled token supply and institutional adoption. Ongoing product innovations, such as limit orders and dollar-cost averaging on Solana, were also highlighted, though price action has remained under broader selling pressure.
Bearish momentum persists despite intraday buyer emergence
Momentum on the daily timeframe is weak, with the MACD signaling strong bearishness and the ADX showing a lack of clear trend. The RSI is in the neutral-sell range, while the Stochastic RSI is overbought and the Commodity Channel Index is neutral, revealing divergence among oscillators. Bull/Bear Power now points to a strong buyer presence intraday, which contrasts with other bearish momentum signals. After opening slightly lower with no notable gap, the price has slipped 7.21% on the day, finishing near session lows within a relatively tight and volatile range, showing persistent selling pressure after the open.
Sustained downside risk as technical signals reinforce range-bound outlook
For the next 5 trading days, JUP is expected to fluctuate between $0.1400 and $0.1690, representing a typical volatility band relative to current levels. There is a very low probability (less than 20%) of a sustained price increase, with a much higher likelihood of downward movement given sustained bearish signals from the weekly MACD, RSI, ADX, and Moving Averages. The baseline scenario is continued sideways trading within the established range. A bullish scenario would require a decisive break above resistance at $0.1748, while a bearish scenario could see the price breaking below $0.1400 support, particularly if selling momentum persists.
Previously it was reported that Jupiter (JUP) is showing near-term recovery, trading above its short-term moving average but remaining under medium- and long-term MAs, reflecting ongoing broader seller pressure. Momentum indicators remain mixed with no clear reversal signal, pointing to mild oversold conditions and high volatility as the asset tests resistance while lacking strong support nearby.


Latest Jupiter News


-
 Afghanistan
-
 Albania
-
 Algeria
-
 Angola
-
 Argentina
-
 Armenia
-
 Australia
-
 Austria
-
 Azerbaijan
-
 Bahamas
-
 Bahrain
-
 Bangladesh
-
 Belarus
-
 Belgium
-
 Bolivia
-
 Botswana
-
 Brazil
-
 Brunei
-
 Bulgaria
-
 Cambodia
-
 Cameroon
-
 Canada
-
 Chile
Chile
-
 China
China
-
 Colombia
-
 Congo
Congo
-
 Costa Rica
-
 Cote d'Ivoire
-
 Croatia
-
 Cuba
Cuba
-
 Cyprus
-
 Czechia
-
 DR Congo
-
 Denmark
-
 Dominican Republic
-
 Ecuador
-
 Egypt
Egypt
-
 El Salvador
-
 Estonia
-
 Eswatini
-
 Ethiopia
-
 Finland
-
 France
-
 Georgia
-
 Germany
-
 Ghana
Ghana
-
 Greece
-
 Haiti
Haiti
-
 Hong Kong
-
 Hungary
-
 India
India
-
 Indonesia
-
 Iran, Islamic republic
-
 Iraq
Iraq
-
 Ireland
-
 Israel
-
 Italy
Italy
-
 Jamaica
-
 Japan
Japan
-
 Jordan
-
 Kazakhstan
-
 Kenya
Kenya
-
 Korea
Korea
-
 Kuwait
-
 Kyrgyzstan
-
 Laos
Laos
-
 Latvia
-
 Lebanon
-
 Lesotho
-
 Libya
Libya
-
 Lithuania
-
 Luxembourg
-
 Madagascar
-
 Malaysia
-
 Malta
Malta
-
 Mauritius
-
 Mexico
-
 Moldova
-
 Mongolia
-
 Montenegro
-
 Morocco
-
 Mozambique
-
 Myanmar
-
 Namibia
-
 Nepal
Nepal
-
 Netherlands
-
 New Zealand
-
 Nigeria
-
 North Macedonia
-
 Norway
-
 Oman
Oman
-
 Pakistan
-
 Palestine
-
 Panama
-
 Papua New Guinea
-
 Paraguay
-
 Peru
Peru
-
 Philippines
-
 Poland
-
 Portugal
-
 Puerto Rico
-
 Qatar
Qatar
-
 Reunion
-
 Romania
-
 Rwanda
-
 Saudi Arabia
-
 Serbia
-
 Singapore
-
 Slovakia
-
 Slovenia
-
 Somalia
-
 South Africa
-
 Spain
Spain
-
 Sri Lanka
-
 Sweden
-
 Switzerland
-
 Syria
Syria
-
 Taiwan
-
 Tajikistan
-
 Tanzania
-
 Thailand
-
 Trinidad and Tobago
-
 Tunisia
-
 Turkey
-
 UAE
UAE
-
 Uganda
-
 Ukraine
-
 United Kingdom
-
United States
-
 Uruguay
-
 Uzbekistan
-
 Venezuela
-
 Vietnam
-
 Yemen
Yemen
-
 Zambia
-
 Zimbabwe
- Forex
- Crypto
