
-8.92% for Ethena — Downtrend confirmed despite spike in USDe supply

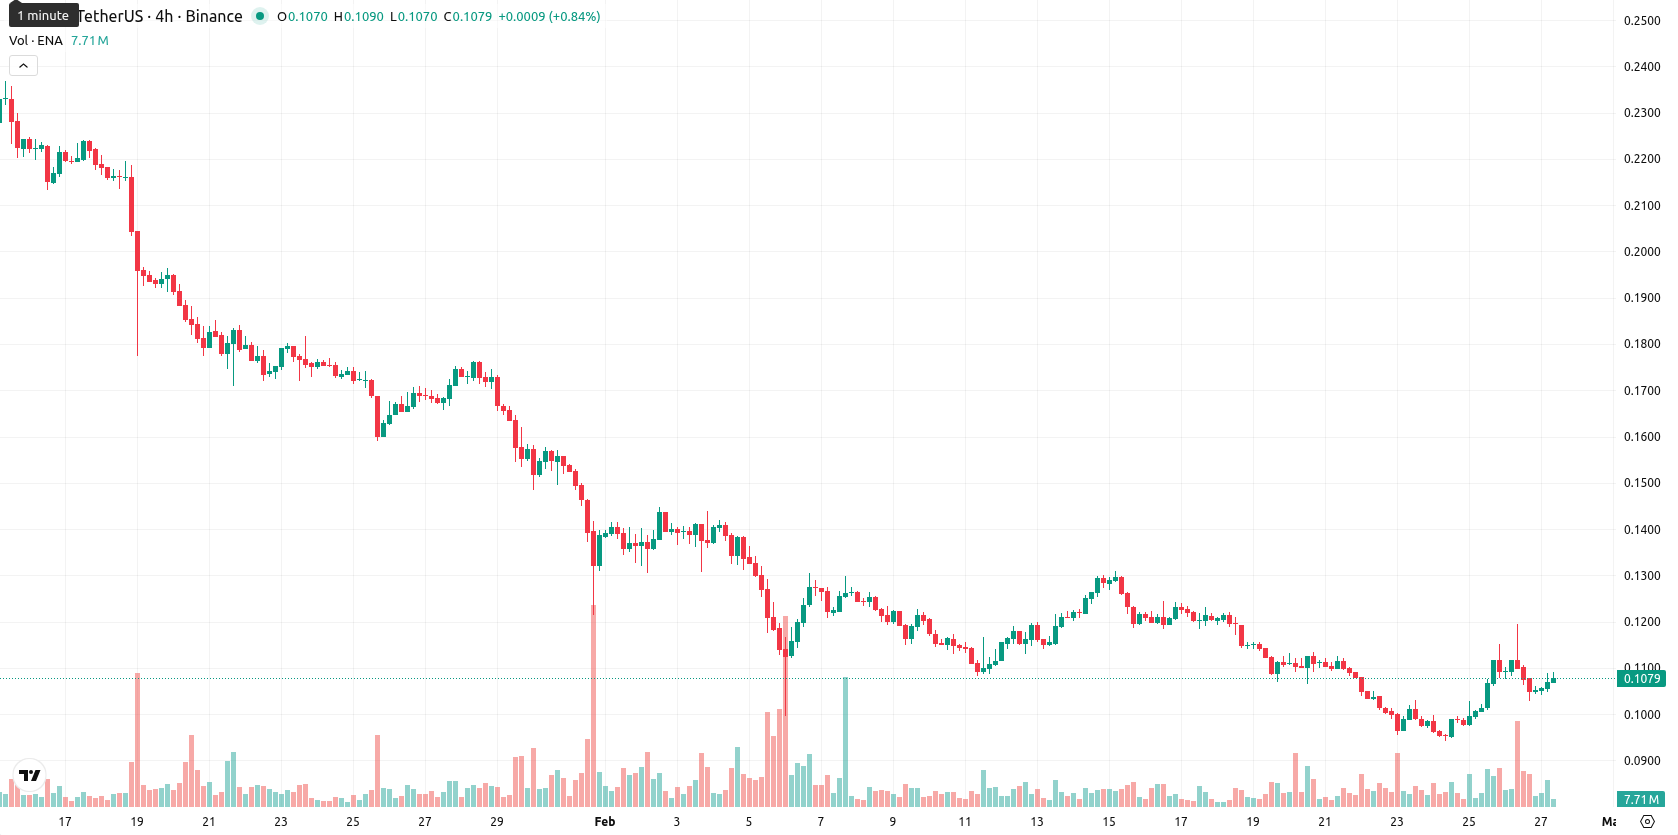
Ethena (ENA) is trading at $0.1083, marking a daily decline of 8.92%. The asset remains below its MA-20 ($0.1142), MA-50 ($0.1552), and MA-200 ($0.3772), reflecting ongoing bearish pressure across all timeframes.
Highlights
- Ethena's Q1 2026 protocol revenue reached $566,730 in the first 47 days, surpassing Q4 2025 earnings of $463,260 and highlighting strong growth.
- USDe stablecoin's circulating supply surged from $120 million in May 2025 to $1.15 billion, with white label supply exceeding $131 million amid ongoing market scrutiny.
- ENA trades at $0.1083 below key resistance levels (MA-20: $0.1142, Kijun: $0.1195), with technical indicators confirming a persistent bearish trend and further downside risk.
Revenue surge meets outflows and token unlock concerns
Ethena reported notable growth in Q1 2026 protocol revenue with $566,730 earned in the first 47 days, exceeding the $463,260 recorded in Q4 2025. The circulating supply of Ethena's USDe stablecoin expanded from $120 million in May 2025 to $1.15 billion, while white label supply surpassed $131 million. These developments were accompanied by continued concerns regarding spot outflows and the approaching March token unlock, which contributed to increased market focus, though price action has remained under broader selling pressure.
Bearish momentum holds as resistance and oscillators diverge
Technically, ENA is sustaining bearish momentum, with the price consistently below the MA-20, MA-50, and MA-200. The Ichimoku Kijun at $0.1195 acts as resistance, backed by a strong sell signal from the MACD and a high ADX of 44.8, confirming a powerful downtrend. The RSI sits at 35.9, indicating mild oversold conditions, supported by similar Commodity Channel Index readings, while the Stochastic RSI is neutral but suggests localized overbought behavior intraday. Though Bull/Bear Power is marginally positive, sellers have dominated intraday action, and a divergence persists between neutral-to-oversold oscillators and strongly bearish momentum indicators.
Sideways trading favored as downside risk dominates outlook
In the short term, ENA is expected to trade within a typical volatility band of $0.098 to $0.119 over the next five days. The probability of a price increase is low, estimated at less than 20%, so further declines are more likely. The main scenario sees ENA moving sideways within this corridor. Should the price break above $0.1195, a recovery attempt may follow, while a drop below $0.098 would indicate risk of deeper downside, in line with ongoing negative momentum.
Previously it was reported that Ethena (ENA) is rebounding intraday but remains in a broader downtrend, trading below key moving averages and facing sustained bearish pressure indicated by negative momentum on the MACD and persistent weakness in the RSI. Despite recent buyer activity and short-term overbought oscillator readings, the asset is expected to consolidate in a range, with support at $0.1000 and resistance at $0.1240, as technical signals suggest limited breakout potential in the immediate term.


Latest Ethena News


-
 Afghanistan
-
 Albania
-
 Algeria
-
 Angola
-
 Argentina
-
 Armenia
-
 Australia
-
 Austria
-
 Azerbaijan
-
 Bahamas
-
 Bahrain
-
 Bangladesh
-
 Belarus
-
 Belgium
-
 Bolivia
-
 Botswana
-
 Brazil
-
 Brunei
-
 Bulgaria
-
 Cambodia
-
 Cameroon
-
 Canada
-
 Chile
Chile
-
 China
China
-
 Colombia
-
 Congo
Congo
-
 Costa Rica
-
 Cote d'Ivoire
-
 Croatia
-
 Cuba
Cuba
-
 Cyprus
-
 Czechia
-
 DR Congo
-
 Denmark
-
 Dominican Republic
-
 Ecuador
-
 Egypt
Egypt
-
 El Salvador
-
 Estonia
-
 Eswatini
-
 Ethiopia
-
 Finland
-
 France
-
 Georgia
-
 Germany
-
 Ghana
Ghana
-
 Greece
-
 Haiti
Haiti
-
 Hong Kong
-
 Hungary
-
 India
India
-
 Indonesia
-
 Iran, Islamic republic
-
 Iraq
Iraq
-
 Ireland
-
 Israel
-
 Italy
Italy
-
 Jamaica
-
 Japan
Japan
-
 Jordan
-
 Kazakhstan
-
 Kenya
Kenya
-
 Korea
Korea
-
 Kuwait
-
 Kyrgyzstan
-
 Laos
Laos
-
 Latvia
-
 Lebanon
-
 Lesotho
-
 Libya
Libya
-
 Lithuania
-
 Luxembourg
-
 Madagascar
-
 Malaysia
-
 Malta
Malta
-
 Mauritius
-
 Mexico
-
 Moldova
-
 Mongolia
-
 Montenegro
-
 Morocco
-
 Mozambique
-
 Myanmar
-
 Namibia
-
 Nepal
Nepal
-
 Netherlands
-
 New Zealand
-
 Nigeria
-
 North Macedonia
-
 Norway
-
 Oman
Oman
-
 Pakistan
-
 Palestine
-
 Panama
-
 Papua New Guinea
-
 Paraguay
-
 Peru
Peru
-
 Philippines
-
 Poland
-
 Portugal
-
 Puerto Rico
-
 Qatar
Qatar
-
 Reunion
-
 Romania
-
 Rwanda
-
 Saudi Arabia
-
 Serbia
-
 Singapore
-
 Slovakia
-
 Slovenia
-
 Somalia
-
 South Africa
-
 Spain
Spain
-
 Sri Lanka
-
 Sweden
-
 Switzerland
-
 Syria
Syria
-
 Taiwan
-
 Tajikistan
-
 Tanzania
-
 Thailand
-
 Trinidad and Tobago
-
 Tunisia
-
 Turkey
-
 UAE
UAE
-
 Uganda
-
 Ukraine
-
 United Kingdom
-
United States
-
 Uruguay
-
 Uzbekistan
-
 Venezuela
-
 Vietnam
-
 Yemen
Yemen
-
 Zambia
-
 Zimbabwe
- Forex
- Crypto
