
DOGE declines further with sellers dominating amid weak support and MACD signaling downside pressure – weekly forecast

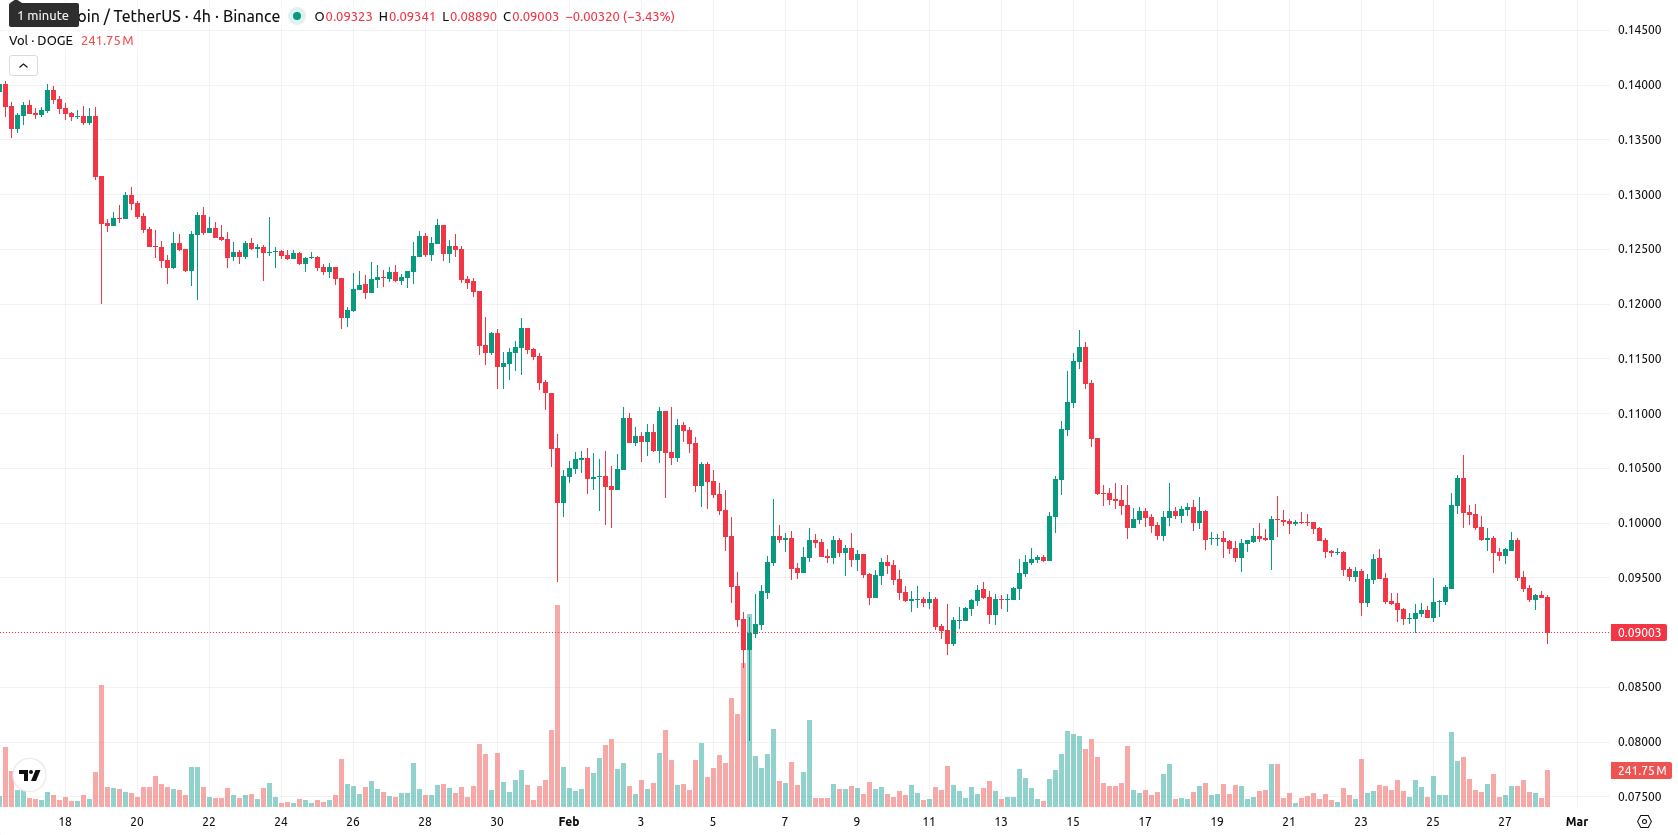
Dogecoin (DOGE) is trading at $0.09003, marking a sharp decline of $0.00847 or 8.60% over the past week. The asset remains firmly below its weekly MA-20 at $0.09740, MA-50 at $0.11272, and MA-200 at $0.17091, confirming strong bearish momentum and a clear downtrend on the weekly timeframe.
Highlights
- Dogecoin is trading at $0.09003, below its MA-20, MA-50, and MA-200, confirming a strong bearish trend across all timeframes.
- Momentum indicators, including daily MACD and ADX, signal persistent downside pressure with near-term bearish sentiment and no nearby moving-average supports.
- For the next five days, Dogecoin is expected to consolidate between $0.081 and $0.099, with over 80% probability of further decline.
Speculative demand intensifies as leveraged traders and profit-taking drive swings
Dogecoin continues to generate heightened speculative demand, with leveraged traders showing a preference for long positions while periods of profit-taking have triggered notable price swings. The asset maintains robust daily trading volume and benefits from widespread exchange listings and active community engagement. Its technical foundation is supported by a Proof-of-Work protocol and merge-mining with Litecoin, and recent on-chain data reflects Dogecoin's role as a central indicator of speculative sentiment in the cryptocurrency market.
Bearish technical structure extends as resistance and high volatility persist
On the weekly chart, Dogecoin remains well below its primary moving averages (MA-20, MA-50, MA-200), with immediate resistance now aligned near the Ichimoku Kijun at $0.09879. No weekly moving average support is close to the current price, reinforcing the prevailing bearish structure. RSI on the weekly frame signals a sell but is not yet oversold, while momentum indicators such as MACD confirm consistent downside pressure. The weekly trading range is wide, with volatility elevated and sellers dominating across key indicators.
Bearish continuation favored as consolidation risks further downside next week
Looking ahead to the next 5–7 trading days, Dogecoin is projected to consolidate within a range of $0.081 to $0.099, as defined by current volatility and weekly technical signals. The probability of a further decline remains very high, with bearish scenarios dominating unless a sustained breakout above $0.099 shifts momentum. A bullish reversal would require the price to clear the Ichimoku Kijun and $0.099 resistance, targeting the $0.10 area, while a further drop below $0.081 could open the way to deeper support if selling pressure intensifies.
Last time, analysts noted that Dogecoin is trading below key moving averages (MA-20, MA-50, MA-200), with bearish momentum persisting as sellers control short, medium, and long-term trends. Momentum indicators such as MACD and ADX confirm continued weakness, while immediate resistance is seen near $0.099 and support in the $0.086–$0.095 range, with low probability of an upside breakout amid range-bound consolidation.


-
 Afghanistan
-
 Albania
-
 Algeria
-
 Angola
-
 Argentina
-
 Armenia
-
 Australia
-
 Austria
-
 Azerbaijan
-
 Bahamas
-
 Bahrain
-
 Bangladesh
-
 Belarus
-
 Belgium
-
 Bolivia
-
 Botswana
-
 Brazil
-
 Brunei
-
 Bulgaria
-
 Cambodia
-
 Cameroon
-
 Canada
-
 Chile
Chile
-
 China
China
-
 Colombia
-
 Congo
Congo
-
 Costa Rica
-
 Cote d'Ivoire
-
 Croatia
-
 Cuba
Cuba
-
 Cyprus
-
 Czechia
-
 DR Congo
-
 Denmark
-
 Dominican Republic
-
 Ecuador
-
 Egypt
Egypt
-
 El Salvador
-
 Estonia
-
 Eswatini
-
 Ethiopia
-
 Finland
-
 France
-
 Georgia
-
 Germany
-
 Ghana
Ghana
-
 Greece
-
 Haiti
Haiti
-
 Hong Kong
-
 Hungary
-
 India
India
-
 Indonesia
-
 Iran, Islamic republic
-
 Iraq
Iraq
-
 Ireland
-
 Israel
-
 Italy
Italy
-
 Jamaica
-
 Japan
Japan
-
 Jordan
-
 Kazakhstan
-
 Kenya
Kenya
-
 Korea
Korea
-
 Kuwait
-
 Kyrgyzstan
-
 Laos
Laos
-
 Latvia
-
 Lebanon
-
 Lesotho
-
 Libya
Libya
-
 Lithuania
-
 Luxembourg
-
 Madagascar
-
 Malaysia
-
 Malta
Malta
-
 Mauritius
-
 Mexico
-
 Moldova
-
 Mongolia
-
 Montenegro
-
 Morocco
-
 Mozambique
-
 Myanmar
-
 Namibia
-
 Nepal
Nepal
-
 Netherlands
-
 New Zealand
-
 Nigeria
-
 North Macedonia
-
 Norway
-
 Oman
Oman
-
 Pakistan
-
 Palestine
-
 Panama
-
 Papua New Guinea
-
 Paraguay
-
 Peru
Peru
-
 Philippines
-
 Poland
-
 Portugal
-
 Puerto Rico
-
 Qatar
Qatar
-
 Reunion
-
 Romania
-
 Rwanda
-
 Saudi Arabia
-
 Serbia
-
 Singapore
-
 Slovakia
-
 Slovenia
-
 Somalia
-
 South Africa
-
 Spain
Spain
-
 Sri Lanka
-
 Sweden
-
 Switzerland
-
 Syria
Syria
-
 Taiwan
-
 Tajikistan
-
 Tanzania
-
 Thailand
-
 Trinidad and Tobago
-
 Tunisia
-
 Turkey
-
 UAE
UAE
-
 Uganda
-
 Ukraine
-
 United Kingdom
-
United States
-
 Uruguay
-
 Uzbekistan
-
 Venezuela
-
 Vietnam
-
 Yemen
Yemen
-
 Zambia
-
 Zimbabwe
- Forex
- Crypto
