
-12.66% for Arbitrum — Negative trend deepens below key moving averages

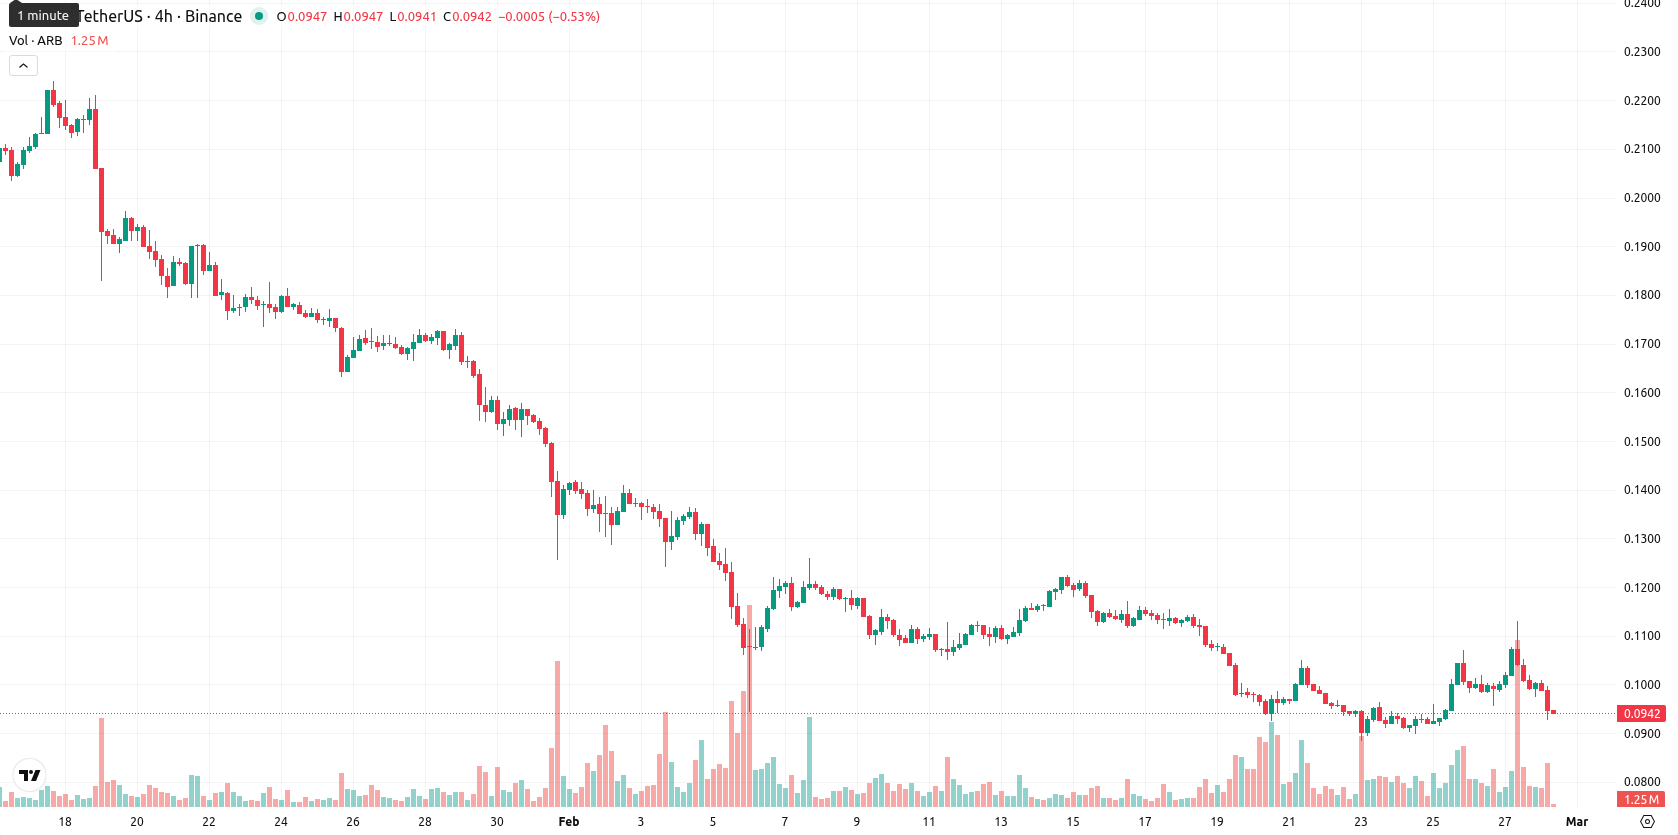
Arbitrum (ARB) is trading at $0.0945, registering a daily decline of 12.66%. The token remains below its MA-20 ($0.1061), MA-50 ($0.1465), and MA-200 ($0.2918), highlighting persistent downward momentum across all key timeframes.
Highlights
- Arbitrum set a new all-time high in monthly transaction volume for February, exceeding prior months by 15% despite only 25 days of activity.
- The Robinhood Chain launched its testnet on the Arbitrum network, expanding the ecosystem and signaling continued development activity.
- ARB trades at $0.0945, below MA-20 ($0.1061), with strong bearish momentum and a five-day range likely between $0.085 and $0.104.
Record transaction volume drives accumulation despite ongoing selling pressure
Arbitrum recorded an all-time high in monthly transaction volume for February, which was 15% higher than any previous month despite only 25 days of activity. The Robinhood Chain launched its testnet on the Arbitrum network, marking an expansion of the ecosystem. Technical signals reflected exchange net outflows and accumulation at a key support zone, though price action has remained under broader selling pressure.
Downside momentum confirmed as all indicators flag intensified bearish action
ARB is currently traded at $0.0945, which is below the MA-20 ($0.1061), MA-50 ($0.1465), and MA-200 ($0.2918), underscoring persistent downward pressure in the short, medium, and long-term trends. The Ichimoku Kijun is at $0.1145, marking immediate resistance above the current price. Momentum signals are clearly negative, with the MACD showing a strong sell and a sharp daily decline of 12.66%. The ADX confirms strong bearish momentum. The RSI and CCI both indicate continued weakness, with the Stochastic RSI in an overbought state — this divergence suggests a risk of a short-term bounce, though sellers maintain dominance according to Bull/Bear Power. The daily session opened just below the previous close, with the price tracking near today’s low, reflecting high volatility and intensifying seller pressure after the open. All intraday dynamics and momentum signals are aligned to the downside.
Further declines likely as volatility band contains short-term outlook
For the next five trading days, the expected price range is likely between $0.085 and $0.104, keeping ARB within a volatility band relative to current levels following the recent move. There is a very low probability (less than 20%) of a sustained price increase, making further declines more likely in the short term. The baseline scenario is continued sideways movement within this corridor, while a bullish case would require a break above the immediate resistance near $0.1145. A bearish scenario implies the price falling below $0.085, which — ahead of additional support levels — remains possible if downward momentum continues to dominate.
Previously it was reported that Arbitrum (ARB) is experiencing continued bearish momentum as it trades well below all major moving averages, with technical indicators including MACD, ADX, and RSI signaling strong selling pressure and a lack of clear support levels. The asset remains under persistent sell bias despite signs of accumulation and increased activity related to testnet developments, with dynamic resistance observed near $0.1145 and ongoing vulnerability to further downside volatility.


-
 Afghanistan
-
 Albania
-
 Algeria
-
 Angola
-
 Argentina
-
 Armenia
-
 Australia
-
 Austria
-
 Azerbaijan
-
 Bahamas
-
 Bahrain
-
 Bangladesh
-
 Belarus
-
 Belgium
-
 Bolivia
-
 Botswana
-
 Brazil
-
 Brunei
-
 Bulgaria
-
 Cambodia
-
 Cameroon
-
 Canada
-
 Chile
Chile
-
 China
China
-
 Colombia
-
 Congo
Congo
-
 Costa Rica
-
 Cote d'Ivoire
-
 Croatia
-
 Cuba
Cuba
-
 Cyprus
-
 Czechia
-
 DR Congo
-
 Denmark
-
 Dominican Republic
-
 Ecuador
-
 Egypt
Egypt
-
 El Salvador
-
 Estonia
-
 Eswatini
-
 Ethiopia
-
 Finland
-
 France
-
 Georgia
-
 Germany
-
 Ghana
Ghana
-
 Greece
-
 Haiti
Haiti
-
 Hong Kong
-
 Hungary
-
 India
India
-
 Indonesia
-
 Iran, Islamic republic
-
 Iraq
Iraq
-
 Ireland
-
 Israel
-
 Italy
Italy
-
 Jamaica
-
 Japan
Japan
-
 Jordan
-
 Kazakhstan
-
 Kenya
Kenya
-
 Korea
Korea
-
 Kuwait
-
 Kyrgyzstan
-
 Laos
Laos
-
 Latvia
-
 Lebanon
-
 Lesotho
-
 Libya
Libya
-
 Lithuania
-
 Luxembourg
-
 Madagascar
-
 Malaysia
-
 Malta
Malta
-
 Mauritius
-
 Mexico
-
 Moldova
-
 Mongolia
-
 Montenegro
-
 Morocco
-
 Mozambique
-
 Myanmar
-
 Namibia
-
 Nepal
Nepal
-
 Netherlands
-
 New Zealand
-
 Nigeria
-
 North Macedonia
-
 Norway
-
 Oman
Oman
-
 Pakistan
-
 Palestine
-
 Panama
-
 Papua New Guinea
-
 Paraguay
-
 Peru
Peru
-
 Philippines
-
 Poland
-
 Portugal
-
 Puerto Rico
-
 Qatar
Qatar
-
 Reunion
-
 Romania
-
 Rwanda
-
 Saudi Arabia
-
 Serbia
-
 Singapore
-
 Slovakia
-
 Slovenia
-
 Somalia
-
 South Africa
-
 Spain
Spain
-
 Sri Lanka
-
 Sweden
-
 Switzerland
-
 Syria
Syria
-
 Taiwan
-
 Tajikistan
-
 Tanzania
-
 Thailand
-
 Trinidad and Tobago
-
 Tunisia
-
 Turkey
-
 UAE
UAE
-
 Uganda
-
 Ukraine
-
 United Kingdom
-
United States
-
 Uruguay
-
 Uzbekistan
-
 Venezuela
-
 Vietnam
-
 Yemen
Yemen
-
 Zambia
-
 Zimbabwe
- Forex
- Crypto
