
Jupiter price prediction: Weak rebound odds as JUP extends losses below $0.15

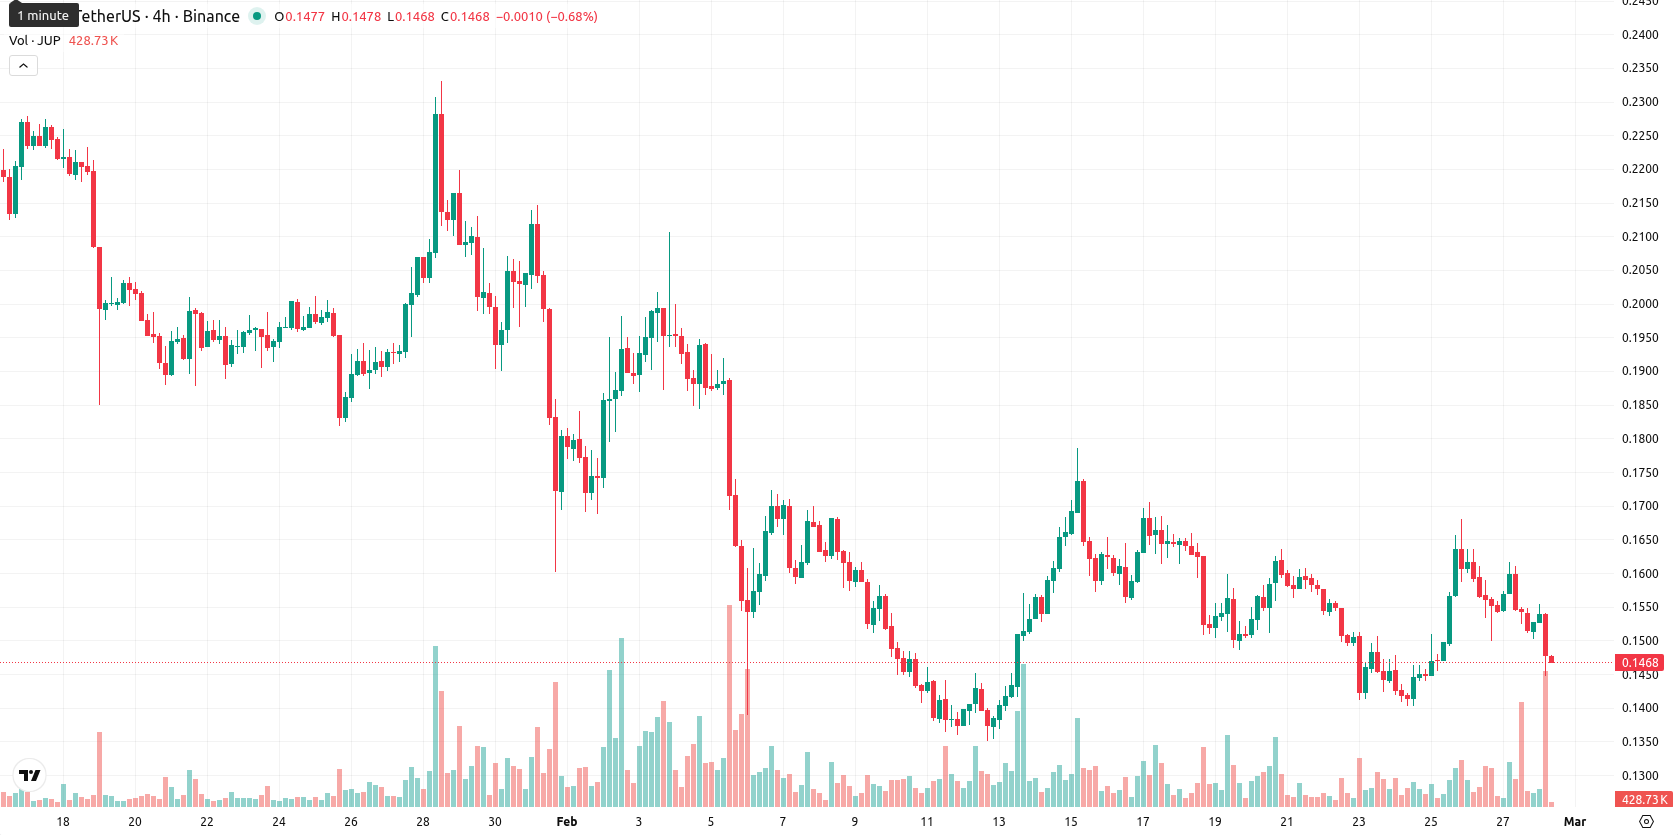
Jupiter (JUP) is trading at $0.1471 after a daily decline of 8.52%, remaining below its MA-20 ($0.1534), MA-50 ($0.1808), and MA-200 ($0.3183), which signals clear downside pressure across short, medium, and long-term timeframes.
Highlights
- JUP is trading at $0.1471, below its MA-20, MA-50, and MA-200 levels, confirming persistent downside pressure across all timeframes.
- Momentum is firmly bearish as indicated by a Strong Sell from the MACD, weak directional strength from the ADX, and an 8.52% price drop today.
- Key support sits at $0.1320 and immediate resistance at $0.1728, with continued volatility expected and a less than 20% probability of a sustained rally.
Bearish indicators converge amid weak momentum and resistance at Kijun
Technical analysis confirms persistent bearish momentum for JUP, with the Ichimoku Kijun at $0.1728 acting as immediate resistance above price. The MACD issues a strong sell reading and the ADX shows weak directional strength, while the RSI at 44.59 remains in bearish territory. The Stochastic RSI and Commodity Channel Index indicate short-term neutrality, and Bull/Bear Power is mildly positive, but the session's direction is set by sellers as the price slipped 8.52%. The price is near the daily low following a gap down at the open, with intraday selling dominating the move and most momentum indicators aligning with a continuation of the downside trend.
Further declines likely as bearish signals cap bullish breakout odds
JUP is expected to remain volatile within a typical five-day trading range between $0.1320 and $0.1720, bracketing current levels. The probability of a sustained upward move is under 20%, with further declines much more likely due to synchronized bearish signals across weekly indicators. The baseline scenario calls for consolidation sideways within this band, with any bullish breakout requiring a close above the $0.1728 resistance — a move that appears unlikely in the near term. A push below $0.1440 could trigger a bearish extension toward the lower end of this week’s volatility band.
Previously it was reported that Jupiter is trading just below its short-term moving average and remains under significant medium- and long-term moving averages, with persistent bearish momentum signaled by the MACD, weak trend strength per the ADX, and divergence among oscillators such as RSI and Stochastic RSI. The price is expected to trade sideways within a defined range, facing immediate resistance at $0.1748 and potential downside risk below $0.1400 if bearish pressure continues.


Latest Jupiter News


-
 Afghanistan
-
 Albania
-
 Algeria
-
 Angola
-
 Argentina
-
 Armenia
-
 Australia
-
 Austria
-
 Azerbaijan
-
 Bahamas
-
 Bahrain
-
 Bangladesh
-
 Belarus
-
 Belgium
-
 Bolivia
-
 Botswana
-
 Brazil
-
 Brunei
-
 Bulgaria
-
 Cambodia
-
 Cameroon
-
 Canada
-
 Chile
Chile
-
 China
China
-
 Colombia
-
 Congo
Congo
-
 Costa Rica
-
 Cote d'Ivoire
-
 Croatia
-
 Cuba
Cuba
-
 Cyprus
-
 Czechia
-
 DR Congo
-
 Denmark
-
 Dominican Republic
-
 Ecuador
-
 Egypt
Egypt
-
 El Salvador
-
 Estonia
-
 Eswatini
-
 Ethiopia
-
 Finland
-
 France
-
 Georgia
-
 Germany
-
 Ghana
Ghana
-
 Greece
-
 Haiti
Haiti
-
 Hong Kong
-
 Hungary
-
 India
India
-
 Indonesia
-
 Iran, Islamic republic
-
 Iraq
Iraq
-
 Ireland
-
 Israel
-
 Italy
Italy
-
 Jamaica
-
 Japan
Japan
-
 Jordan
-
 Kazakhstan
-
 Kenya
Kenya
-
 Korea
Korea
-
 Kuwait
-
 Kyrgyzstan
-
 Laos
Laos
-
 Latvia
-
 Lebanon
-
 Lesotho
-
 Libya
Libya
-
 Lithuania
-
 Luxembourg
-
 Madagascar
-
 Malaysia
-
 Malta
Malta
-
 Mauritius
-
 Mexico
-
 Moldova
-
 Mongolia
-
 Montenegro
-
 Morocco
-
 Mozambique
-
 Myanmar
-
 Namibia
-
 Nepal
Nepal
-
 Netherlands
-
 New Zealand
-
 Nigeria
-
 North Macedonia
-
 Norway
-
 Oman
Oman
-
 Pakistan
-
 Palestine
-
 Panama
-
 Papua New Guinea
-
 Paraguay
-
 Peru
Peru
-
 Philippines
-
 Poland
-
 Portugal
-
 Puerto Rico
-
 Qatar
Qatar
-
 Reunion
-
 Romania
-
 Rwanda
-
 Saudi Arabia
-
 Serbia
-
 Singapore
-
 Slovakia
-
 Slovenia
-
 Somalia
-
 South Africa
-
 Spain
Spain
-
 Sri Lanka
-
 Sweden
-
 Switzerland
-
 Syria
Syria
-
 Taiwan
-
 Tajikistan
-
 Tanzania
-
 Thailand
-
 Trinidad and Tobago
-
 Tunisia
-
 Turkey
-
 UAE
UAE
-
 Uganda
-
 Ukraine
-
 United Kingdom
-
United States
-
 Uruguay
-
 Uzbekistan
-
 Venezuela
-
 Vietnam
-
 Yemen
Yemen
-
 Zambia
-
 Zimbabwe
- Forex
- Crypto
