
-7.77% for Theta — Downward trend confirmed by multiple sell signals

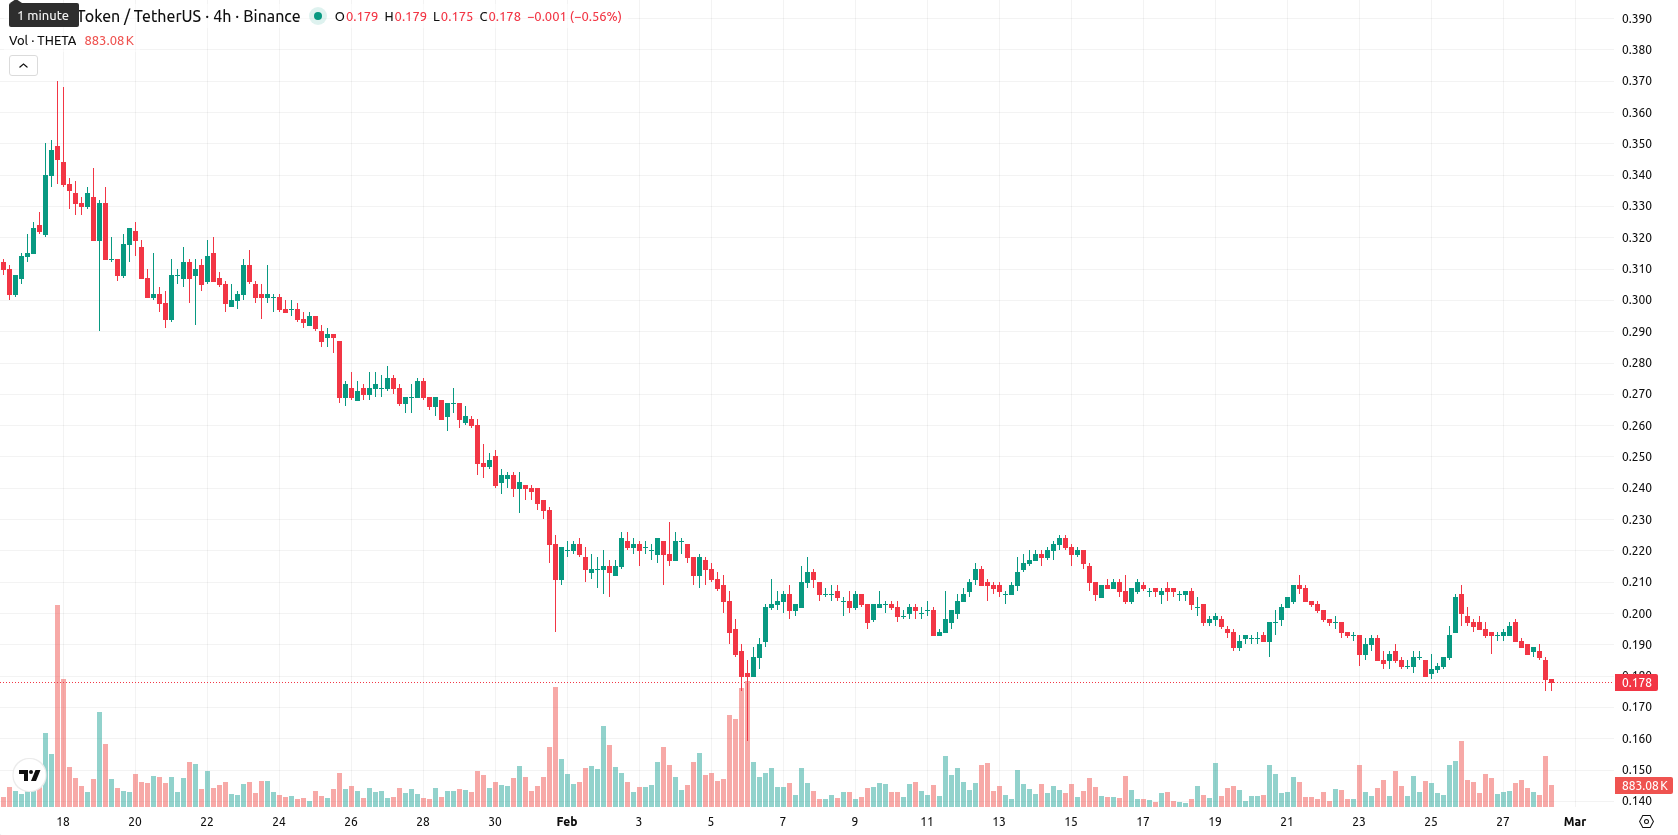
Theta (THETA) is trading at $0.178, reflecting a daily decline of 7.77%. The asset remains positioned below its MA-20 ($0.2008), MA-50 ($0.2439), and MA-200 ($0.4745), indicating persistent selling pressure across all key trend periods.
Highlights
- THETA trades at $0.178, below its MA-20 ($0.2008), MA-50 ($0.2439), and MA-200 ($0.4745), reflecting sustained bearish momentum across timeframes.
- Momentum indicators including MACD, ADX, RSI, and CCI all signal strong selling pressure and oversold conditions, with a 7.77% daily decline and high intraday volatility.
- Near-term price action is expected to consolidate between $0.160 and $0.200; a break below $0.160 could accelerate further declines, while resistance stands at $0.1940.
Deepening bearish momentum as oscillators remain oversold
Momentum indicators suggest a firm bearish tone: the MACD signals a strong sell and the ADX confirms a well-established downward trend. Both the RSI and Commodity Channel Index remain in sell and oversold territory, while the Stochastic RSI is retreating from elevated levels. Bull/Bear Power is slightly positive on the D1 but indicates strong selling intraday, showing sellers continue to dominate. The daily performance shows a decline of 7.77% with no significant gap between the previous close ($0.193) and today’s open ($0.188), as the price hovers near the lower end of today’s range ($0.175–$0.19), underscoring high intraday volatility and persistent pressure after the open. Despite a neutral reading from the Awesome Oscillator, most momentum and oscillator signals are bearish and confirm the weak price action.
Downside risk prevails as breakout depends on resistance test
Looking to the week ahead, with current price action and volatility considered, the expected range for the next five trading days is likely between $0.160 and $0.200. The probability of a price increase is very low (less than 20%), making further declines much more likely. The baseline scenario sees THETA consolidating in a sideways corridor between $0.160 and $0.200. A bullish scenario would require a sustained move above the immediate resistance near $0.1940, while a bearish scenario unfolds if the price drops below short-term support near $0.160, potentially accelerating downward momentum.
Previously it was reported that Theta is exhibiting sustained selling pressure, trading below its 20-, 50-, and 200-day moving averages, with bearish momentum confirmed by negative MACD and ADX readings. Despite immediate resistance at $0.2000 and mixed oscillator signals, the price is expected to move sideways within the $0.155 to $0.220 range as breakout risks remain low.


Latest Theta News


-
 Afghanistan
-
 Albania
-
 Algeria
-
 Angola
-
 Argentina
-
 Armenia
-
 Australia
-
 Austria
-
 Azerbaijan
-
 Bahamas
-
 Bahrain
-
 Bangladesh
-
 Belarus
-
 Belgium
-
 Bolivia
-
 Botswana
-
 Brazil
-
 Brunei
-
 Bulgaria
-
 Cambodia
-
 Cameroon
-
 Canada
-
 Chile
Chile
-
 China
China
-
 Colombia
-
 Congo
Congo
-
 Costa Rica
-
 Cote d'Ivoire
-
 Croatia
-
 Cuba
Cuba
-
 Cyprus
-
 Czechia
-
 DR Congo
-
 Denmark
-
 Dominican Republic
-
 Ecuador
-
 Egypt
Egypt
-
 El Salvador
-
 Estonia
-
 Eswatini
-
 Ethiopia
-
 Finland
-
 France
-
 Georgia
-
 Germany
-
 Ghana
Ghana
-
 Greece
-
 Haiti
Haiti
-
 Hong Kong
-
 Hungary
-
 India
India
-
 Indonesia
-
 Iran, Islamic republic
-
 Iraq
Iraq
-
 Ireland
-
 Israel
-
 Italy
Italy
-
 Jamaica
-
 Japan
Japan
-
 Jordan
-
 Kazakhstan
-
 Kenya
Kenya
-
 Korea
Korea
-
 Kuwait
-
 Kyrgyzstan
-
 Laos
Laos
-
 Latvia
-
 Lebanon
-
 Lesotho
-
 Libya
Libya
-
 Lithuania
-
 Luxembourg
-
 Madagascar
-
 Malaysia
-
 Malta
Malta
-
 Mauritius
-
 Mexico
-
 Moldova
-
 Mongolia
-
 Montenegro
-
 Morocco
-
 Mozambique
-
 Myanmar
-
 Namibia
-
 Nepal
Nepal
-
 Netherlands
-
 New Zealand
-
 Nigeria
-
 North Macedonia
-
 Norway
-
 Oman
Oman
-
 Pakistan
-
 Palestine
-
 Panama
-
 Papua New Guinea
-
 Paraguay
-
 Peru
Peru
-
 Philippines
-
 Poland
-
 Portugal
-
 Puerto Rico
-
 Qatar
Qatar
-
 Reunion
-
 Romania
-
 Rwanda
-
 Saudi Arabia
-
 Serbia
-
 Singapore
-
 Slovakia
-
 Slovenia
-
 Somalia
-
 South Africa
-
 Spain
Spain
-
 Sri Lanka
-
 Sweden
-
 Switzerland
-
 Syria
Syria
-
 Taiwan
-
 Tajikistan
-
 Tanzania
-
 Thailand
-
 Trinidad and Tobago
-
 Tunisia
-
 Turkey
-
 UAE
UAE
-
 Uganda
-
 Ukraine
-
 United Kingdom
-
United States
-
 Uruguay
-
 Uzbekistan
-
 Venezuela
-
 Vietnam
-
 Yemen
Yemen
-
 Zambia
-
 Zimbabwe
- Forex
- Crypto
