
Mixed oscillator signals and resistance at MA-50 — Plasma jumps 9.30%

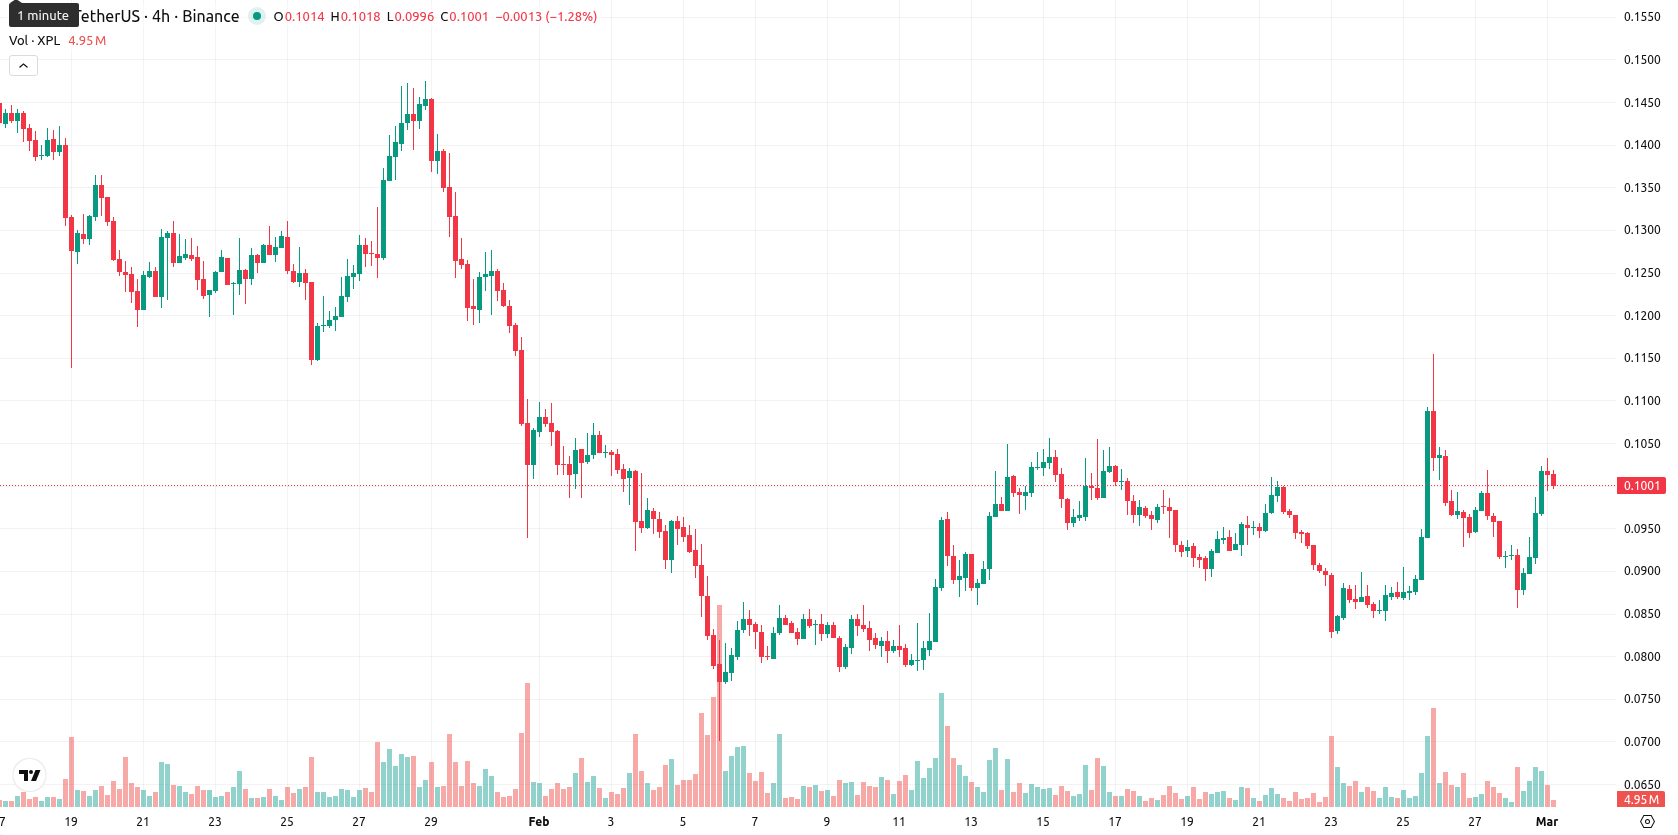
Plasma (XPL) is trading at $0.0999, up 9.30% on the day. The asset sits above both its MA-20 ($0.0933) and Ichimoku Kijun ($0.0927) support levels, but remains below the MA-50 ($0.1119), signaling short-term bullish momentum with lingering medium-term resistance.
Highlights
- XPL currently trades at $0.0999, above the MA-20 ($0.0933) and Ichimoku Kijun ($0.0927) but remains under the MA-50 ($0.1119).
- Momentum indicators are mixed, with the MACD strongly bearish, ADX favoring sellers, and Stochastic RSI indicating overbought conditions and risk of a pullback.
- XPL is expected to fluctuate between $0.0900 and $0.1120 this week, with a probability of further price rise below 20% based on weak trend indicators.
Bearish undertone persists as mixed signals drive choppy action
Momentum indicators for XPL are mixed on the daily chart. The MACD points to strong bearishness despite buyers showing intraday dominance, and the ADX suggests sellers still hold the upper hand with moderate directional strength. The RSI reflects a mild bullish tilt without overbought conditions, while the Stochastic RSI is strongly overbought, indicating risk of a near-term pullback. The Bull/Bear Power indicator confirms robust buyer activity, with the price holding mid-range within today’s session’s tight high-low ($0.0994 – $0.1033) and overall moderate volatility. Oscillator divergence suggests choppy price action may continue in the near term.
Rangebound trade expected as breakout chances diminish
In the short term, XPL is projected to trade within a volatility band of $0.0900 to $0.1120, consistent with recent price swings. Weekly trend readings point to a low likelihood of further upward movement (less than 20%), making a pullback the more probable scenario. Sideways trading between immediate support and nearby resistance is expected. A sustained move above $0.1120 would signal a bullish breakout, while a close below $0.0900 would likely trigger additional selling pressure.
Previously it was reported that Plasma (XPL) remains under pronounced seller control, trading below both its 20- and 50-day moving averages with the price positioned beneath the Ichimoku Kijun level, signaling persistent short- and medium-term bearish pressure. Momentum indicators including MACD, ADX, and RSI point to a strong negative trend, with limited buying interest and volatility elevated as XPL fluctuates within a support range of $0.0800 to resistance around $0.0980.


Latest Plasma News


-
 Afghanistan
-
 Albania
-
 Algeria
-
 Angola
-
 Argentina
-
 Armenia
-
 Australia
-
 Austria
-
 Azerbaijan
-
 Bahamas
-
 Bahrain
-
 Bangladesh
-
 Belarus
-
 Belgium
-
 Bolivia
-
 Botswana
-
 Brazil
-
 Brunei
-
 Bulgaria
-
 Cambodia
-
 Cameroon
-
 Canada
-
 Chile
Chile
-
 China
China
-
 Colombia
-
 Congo
Congo
-
 Costa Rica
-
 Cote d'Ivoire
-
 Croatia
-
 Cuba
Cuba
-
 Cyprus
-
 Czechia
-
 DR Congo
-
 Denmark
-
 Dominican Republic
-
 Ecuador
-
 Egypt
Egypt
-
 El Salvador
-
 Estonia
-
 Eswatini
-
 Ethiopia
-
 Finland
-
 France
-
 Georgia
-
 Germany
-
 Ghana
Ghana
-
 Greece
-
 Haiti
Haiti
-
 Hong Kong
-
 Hungary
-
 India
India
-
 Indonesia
-
 Iran, Islamic republic
-
 Iraq
Iraq
-
 Ireland
-
 Israel
-
 Italy
Italy
-
 Jamaica
-
 Japan
Japan
-
 Jordan
-
 Kazakhstan
-
 Kenya
Kenya
-
 Korea
Korea
-
 Kuwait
-
 Kyrgyzstan
-
 Laos
Laos
-
 Latvia
-
 Lebanon
-
 Lesotho
-
 Libya
Libya
-
 Lithuania
-
 Luxembourg
-
 Madagascar
-
 Malaysia
-
 Malta
Malta
-
 Mauritius
-
 Mexico
-
 Moldova
-
 Mongolia
-
 Montenegro
-
 Morocco
-
 Mozambique
-
 Myanmar
-
 Namibia
-
 Nepal
Nepal
-
 Netherlands
-
 New Zealand
-
 Nigeria
-
 North Macedonia
-
 Norway
-
 Oman
Oman
-
 Pakistan
-
 Palestine
-
 Panama
-
 Papua New Guinea
-
 Paraguay
-
 Peru
Peru
-
 Philippines
-
 Poland
-
 Portugal
-
 Puerto Rico
-
 Qatar
Qatar
-
 Reunion
-
 Romania
-
 Rwanda
-
 Saudi Arabia
-
 Serbia
-
 Singapore
-
 Slovakia
-
 Slovenia
-
 Somalia
-
 South Africa
-
 Spain
Spain
-
 Sri Lanka
-
 Sweden
-
 Switzerland
-
 Syria
Syria
-
 Taiwan
-
 Tajikistan
-
 Tanzania
-
 Thailand
-
 Trinidad and Tobago
-
 Tunisia
-
 Turkey
-
 UAE
UAE
-
 Uganda
-
 Ukraine
-
 United Kingdom
-
United States
-
 Uruguay
-
 Uzbekistan
-
 Venezuela
-
 Vietnam
-
 Yemen
Yemen
-
 Zambia
-
 Zimbabwe
- Forex
- Crypto
