
US-Israel strikes on Iran — Bitcoin gains 5.57%

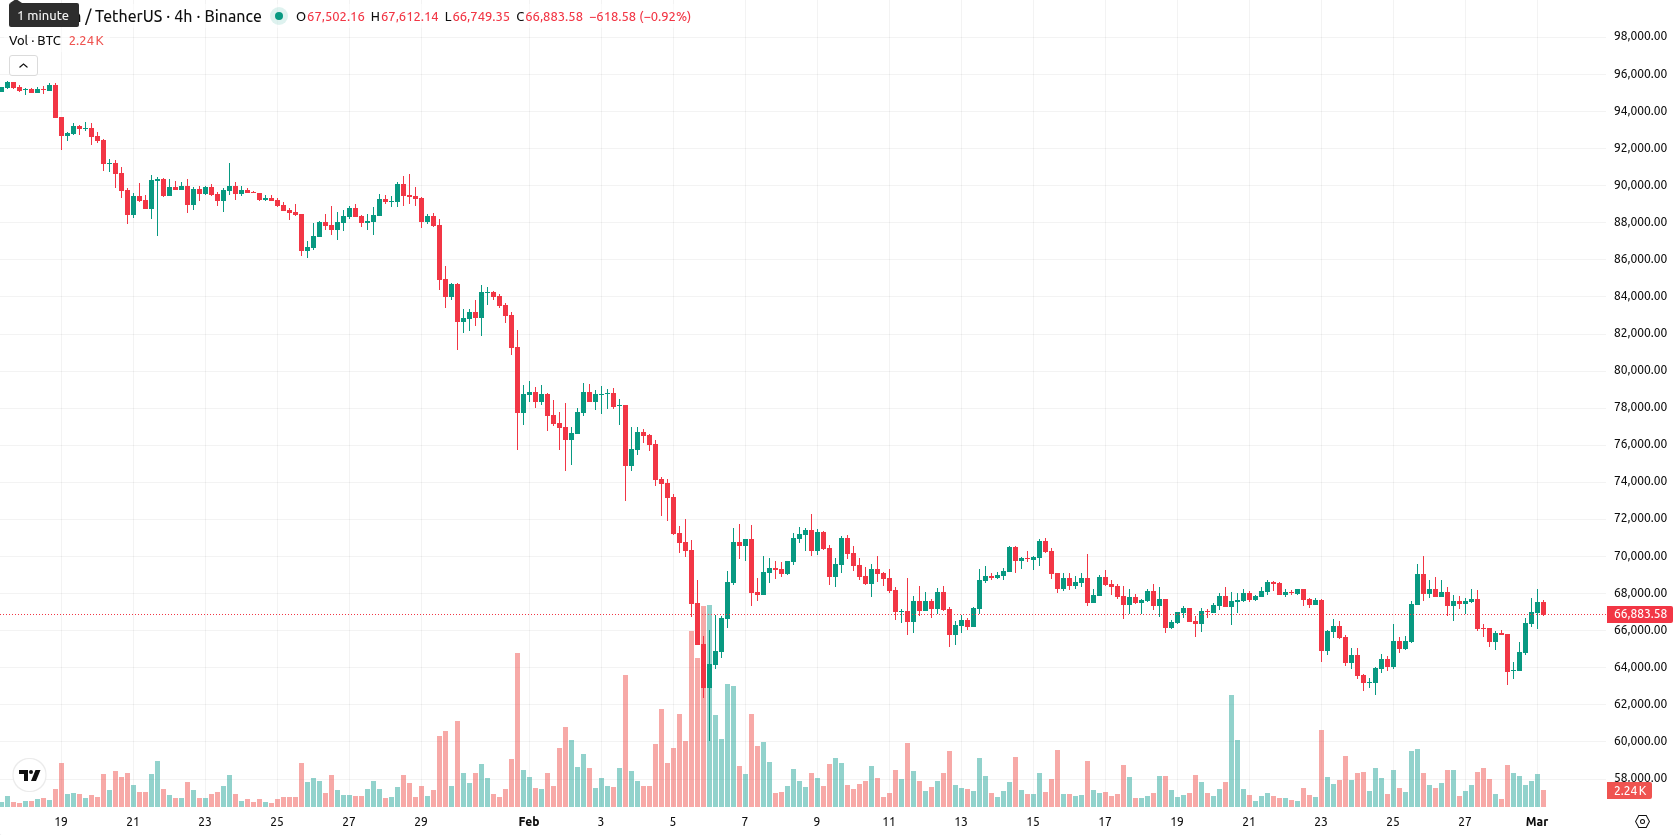
Bitcoin (BTC) is trading at $66,931.34 after climbing 5.57% today, positioning it just below the MA-20 at $67,519.38 and well under both the MA-50 at $78,268.30 and MA-200 at $97,383.16, which signals persistent short- and medium-term selling pressure within a bearish long-term trend.
 63827.49
66739.89
63827.49
66739.89
Highlights
- Coordinated U.S. and Israeli strikes against Iran on February 28, 2026, caused Bitcoin to drop below $64,000 amid surging geopolitical risk and global liquidity flight.
- Military actions threaten Iran’s Bitcoin mining and stablecoin infrastructure, increasing network disruption risks and regulatory scrutiny, intensifying compliance and external threat exposure for BTC/USD.
- Technically, Bitcoin trades at $66,931.34 with sideways movement likely between $60,000 support and $69,500 resistance, and less than a 20% probability of a sustained price increase in the next five days.
Geopolitical escalation intensifies risk as sanctions target bitcoin infrastructure
On February 28, 2026, coordinated military strikes by the United States and Israel against Iran triggered a sharp escalation in geopolitical risk, causing Bitcoin (BTC) to plummet below $64,000 as market participants rapidly sought liquidity. The regional conflict disrupted risk sentiment globally, fueling inflation concerns due to a spike in oil prices and prompting flight-to-safety allocations away from volatile assets like BTC. Iran’s reliance on a multi-billion-dollar Bitcoin mining and stablecoin infrastructure to bypass sanctions introduced direct threats to the Bitcoin network, as military actions endangered Iran's power grid and mining operations, potentially reducing global supply or shifting hashrate distribution. The intensification of sanctions and possible regulatory responses—such as heightened enforcement against crypto transactions linked to sanctioned entities—have increased compliance risk and scrutiny for Bitcoin markets. Ongoing U.S. tariff uncertainty and potential regulatory reforms in the United States compound macroeconomic pressures, further increasing volatility and external threat exposure for BTC/USD.
Momentum divergence emerges as downward trend and volatility persist
Technically, BTC remains below key moving averages, with immediate Ichimoku Kijun resistance at $69,593.41. The MACD on the daily chart signals a strong sell, and the ADX also indicates downward momentum with high directional strength. RSI and CCI both point to mild oversold conditions, while the Stochastic RSI is deep in overbought territory, showing divergence and potential exhaustion after the recent rebound. Bull/Bear Power suggests sustained short-term buyer presence, and high intraday volatility is noted as BTC trades in the middle of today’s $66,069.06 – $68,193.17 range after a substantial opening gap.
Rangebound outlook favored as breakout likelihood remains limited
In the coming five trading days, BTC is expected to stay within a typical volatility band of $60,000 – $73,500. The likelihood of a sustained advance is low (less than 20%), so a sideways move between support at $60,000 and resistance at $69,500 is the base scenario. Should BTC break above $69,500, the recent highs near $73,500 may be tested. However, a bearish move below $60,000 could trigger further downside, as technical momentum and longer-term averages continue to favor sellers.
Last time, analysts noted that Bitcoin was trading just below the 20-day moving average, with persistent selling pressure keeping it well under the 50-day and 200-day MAs despite short-term stabilization. Technical indicators including the MACD, ADX, and RSI point to ongoing seller dominance and overbought risks, while range-bound trading between nearby support at $63,500 and resistance near $69,600 is expected to persist amid market uncertainty.


Latest Bitcoin News






-
 Afghanistan
-
 Albania
-
 Algeria
-
 Angola
-
 Argentina
-
 Armenia
-
 Australia
-
 Austria
-
 Azerbaijan
-
 Bahamas
-
 Bahrain
-
 Bangladesh
-
 Belarus
-
 Belgium
-
 Bolivia
-
 Botswana
-
 Brazil
-
 Brunei
-
 Bulgaria
-
 Cambodia
-
 Cameroon
-
 Canada
-
 Chile
Chile
-
 China
China
-
 Colombia
-
 Congo
Congo
-
 Costa Rica
-
 Cote d'Ivoire
-
 Croatia
-
 Cuba
Cuba
-
 Cyprus
-
 Czechia
-
 DR Congo
-
 Denmark
-
 Dominican Republic
-
 Ecuador
-
 Egypt
Egypt
-
 El Salvador
-
 Estonia
-
 Eswatini
-
 Ethiopia
-
 Finland
-
 France
-
 Georgia
-
 Germany
-
 Ghana
Ghana
-
 Greece
-
 Haiti
Haiti
-
 Hong Kong
-
 Hungary
-
 India
India
-
 Indonesia
-
 Iran, Islamic republic
-
 Iraq
Iraq
-
 Ireland
-
 Israel
-
 Italy
Italy
-
 Jamaica
-
 Japan
Japan
-
 Jordan
-
 Kazakhstan
-
 Kenya
Kenya
-
 Korea
Korea
-
 Kuwait
-
 Kyrgyzstan
-
 Laos
Laos
-
 Latvia
-
 Lebanon
-
 Lesotho
-
 Libya
Libya
-
 Lithuania
-
 Luxembourg
-
 Madagascar
-
 Malaysia
-
 Malta
Malta
-
 Mauritius
-
 Mexico
-
 Moldova
-
 Mongolia
-
 Montenegro
-
 Morocco
-
 Mozambique
-
 Myanmar
-
 Namibia
-
 Nepal
Nepal
-
 Netherlands
-
 New Zealand
-
 Nigeria
-
 North Macedonia
-
 Norway
-
 Oman
Oman
-
 Pakistan
-
 Palestine
-
 Panama
-
 Papua New Guinea
-
 Paraguay
-
 Peru
Peru
-
 Philippines
-
 Poland
-
 Portugal
-
 Puerto Rico
-
 Qatar
Qatar
-
 Reunion
-
 Romania
-
 Rwanda
-
 Saudi Arabia
-
 Serbia
-
 Singapore
-
 Slovakia
-
 Slovenia
-
 Somalia
-
 South Africa
-
 Spain
Spain
-
 Sri Lanka
-
 Sweden
-
 Switzerland
-
 Syria
Syria
-
 Taiwan
-
 Tajikistan
-
 Tanzania
-
 Thailand
-
 Trinidad and Tobago
-
 Tunisia
-
 Turkey
-
 UAE
UAE
-
 Uganda
-
 Ukraine
-
 United Kingdom
-
United States
-
 Uruguay
-
 Uzbekistan
-
 Venezuela
-
 Vietnam
-
 Yemen
Yemen
-
 Zambia
-
 Zimbabwe
- Forex
- Crypto












