
Stellar hovers near $0.1534 with weak RSI and bearish MACD confirming negative sentiment – weekly analysis

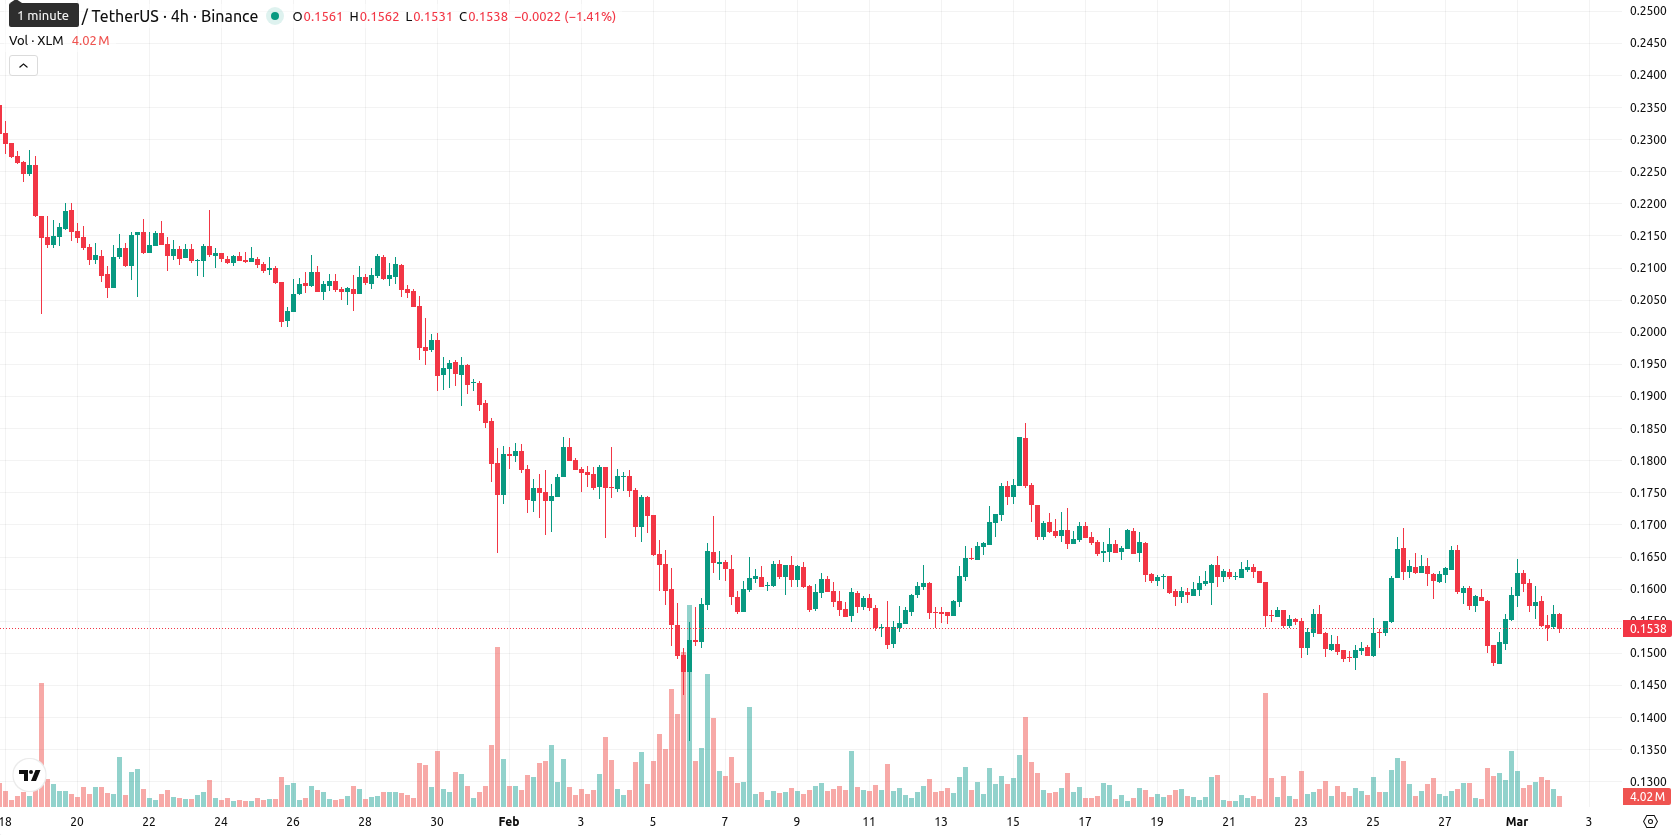
Stellar (XLM) is currently trading at $0.1534, posting a weekly decline of $0.0071, or -4.42%. The asset remains below its weekly MA-20 ($0.1605), MA-50 ($0.1840), and MA-200 ($0.2776), confirming persistent bearish pressure across short-, medium-, and long-term moving averages.
Highlights
- XLM is trading at $0.1534, below the MA-20 ($0.1605), MA-50 ($0.1840), and MA-200 ($0.2776), indicating sustained bearish momentum across all timeframes.
- Daily indicators like MACD, ADX, and RSI (39.3) confirm ongoing weakness, with the price dropping 4.42% and intraday trading near the session's low.
- XLM is likely to fluctuate between $0.140 and $0.165 over the next five days, with a probability under 20% for a significant upside breakout.
Technical weakness persists as momentum signals support sustained downside this week
On the weekly timeframe, XLM continues to exhibit weakness as it remains under key moving averages. The Ichimoku Kijun at $0.1610 serves as the nearest dynamic resistance, while support is currently observed just above $0.1530. Weekly RSI sits in negative territory but stops short of signaling extreme oversold conditions. Other W1 momentum indicators, including the MACD and ADX, confirm sustained bearish sentiment, with no reversal patterns identified.
Limited breakout risk as weekly forecast sees XLM capped in narrow range
Based on weekly indicators, XLM is likely to trade between $0.140 and $0.165 over the next five to seven trading days. The probability of a decisive upward move is low, with less than a 20% chance of a breakout above $0.1610. If XLM falls below $0.150, a potential retest of the $0.140 level becomes likely, while any rally would require a sustained close above resistance to shift the outlook.
Last time, analysts noted that Stellar (XLM) is stabilizing just above short-term support but remains pressured by bearish medium- and long-term trends, as indicated by its position below key moving averages and persistent negative momentum signals from MACD, ADX, and RSI. The outlook remains cautious, with volatility elevated and technicals suggesting continued sideways trading within a defined range, unless a break of immediate support or resistance levels occurs.


Latest Stellar News


-
 Afghanistan
-
 Albania
-
 Algeria
-
 Angola
-
 Argentina
-
 Armenia
-
 Australia
-
 Austria
-
 Azerbaijan
-
 Bahamas
-
 Bahrain
-
 Bangladesh
-
 Belarus
-
 Belgium
-
 Bolivia
-
 Botswana
-
 Brazil
-
 Brunei
-
 Bulgaria
-
 Cambodia
-
 Cameroon
-
 Canada
-
 Chile
Chile
-
 China
China
-
 Colombia
-
 Congo
Congo
-
 Costa Rica
-
 Cote d'Ivoire
-
 Croatia
-
 Cuba
Cuba
-
 Cyprus
-
 Czechia
-
 DR Congo
-
 Denmark
-
 Dominican Republic
-
 Ecuador
-
 Egypt
Egypt
-
 El Salvador
-
 Estonia
-
 Eswatini
-
 Ethiopia
-
 Finland
-
 France
-
 Georgia
-
 Germany
-
 Ghana
Ghana
-
 Greece
-
 Haiti
Haiti
-
 Hong Kong
-
 Hungary
-
 India
India
-
 Indonesia
-
 Iran, Islamic republic
-
 Iraq
Iraq
-
 Ireland
-
 Israel
-
 Italy
Italy
-
 Jamaica
-
 Japan
Japan
-
 Jordan
-
 Kazakhstan
-
 Kenya
Kenya
-
 Korea
Korea
-
 Kuwait
-
 Kyrgyzstan
-
 Laos
Laos
-
 Latvia
-
 Lebanon
-
 Lesotho
-
 Libya
Libya
-
 Lithuania
-
 Luxembourg
-
 Madagascar
-
 Malaysia
-
 Malta
Malta
-
 Mauritius
-
 Mexico
-
 Moldova
-
 Mongolia
-
 Montenegro
-
 Morocco
-
 Mozambique
-
 Myanmar
-
 Namibia
-
 Nepal
Nepal
-
 Netherlands
-
 New Zealand
-
 Nigeria
-
 North Macedonia
-
 Norway
-
 Oman
Oman
-
 Pakistan
-
 Palestine
-
 Panama
-
 Papua New Guinea
-
 Paraguay
-
 Peru
Peru
-
 Philippines
-
 Poland
-
 Portugal
-
 Puerto Rico
-
 Qatar
Qatar
-
 Reunion
-
 Romania
-
 Rwanda
-
 Saudi Arabia
-
 Serbia
-
 Singapore
-
 Slovakia
-
 Slovenia
-
 Somalia
-
 South Africa
-
 Spain
Spain
-
 Sri Lanka
-
 Sweden
-
 Switzerland
-
 Syria
Syria
-
 Taiwan
-
 Tajikistan
-
 Tanzania
-
 Thailand
-
 Trinidad and Tobago
-
 Tunisia
-
 Turkey
-
 UAE
UAE
-
 Uganda
-
 Ukraine
-
 United Kingdom
-
United States
-
 Uruguay
-
 Uzbekistan
-
 Venezuela
-
 Vietnam
-
 Yemen
Yemen
-
 Zambia
-
 Zimbabwe
- Forex
- Crypto
