
Arbitrum rises 7.5% as intraday buyers challenge prevailing downtrend

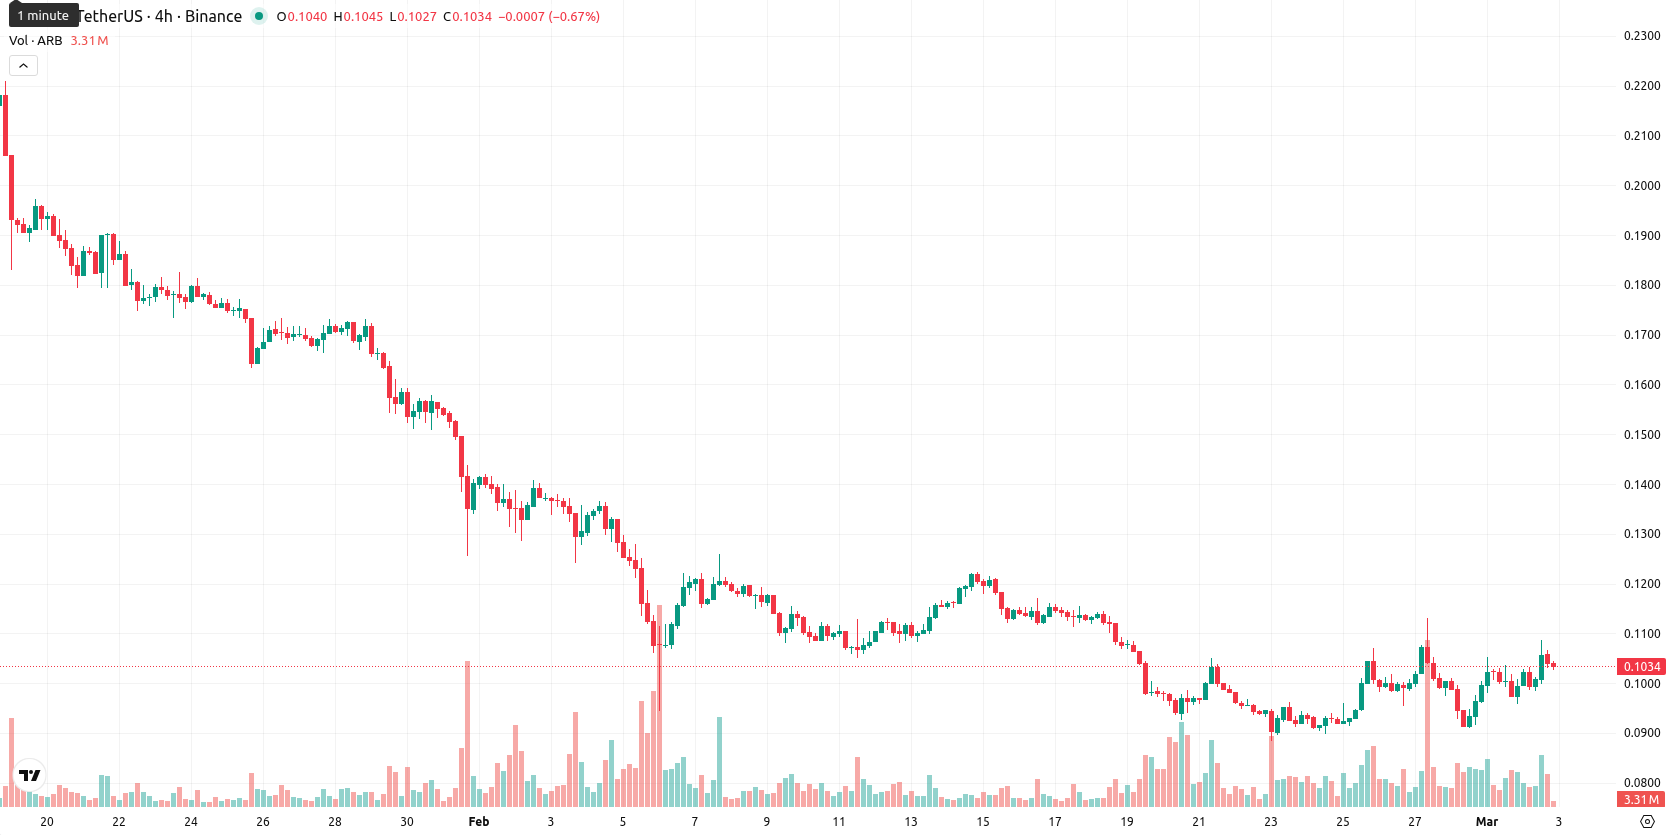
Arbitrum (ARB) is trading at $0.1032, below the MA-20 ($0.1045), MA-50 ($0.1422), and MA-200 ($0.2876), indicating persistent short-, medium-, and long-term downside pressure. The Ichimoku Kijun at $0.1124 stands above the current price, marking immediate resistance.
Highlights
- Arbitrum faces sustained selling pressure as the Chaikin Money Flow indicates net capital outflows and weak buyer participation.
- Short-term holders are realizing profits according to the MVRV Long/Short Difference metric, further undermining price stability amid ongoing weakness.
- ARB is trading at $0.1032, below major moving averages and immediate Ichimoku resistance at $0.1124, with bearish momentum and likely consolidation between $0.092 and $0.113.
Ongoing capital outflows as short-term holders realize profits
Arbitrum has continued to experience selling pressure as the token struggles to attract sustained investor demand. The Chaikin Money Flow indicator is showing net capital outflows, reflecting ongoing selling activity and weak buyer participation. The MVRV Long/Short Difference metric highlights that short-term holders are realizing profits, adding to price vulnerability.
Sellers retain momentum as conflicting oscillators fuel volatility
Momentum signals remain negative, with both the MACD and ADX on the daily chart indicating a sell bias and suggesting sellers maintain control. The RSI is weak at 34, the Stochastic RSI shows overbought conditions, and the CCI is neutral, revealing conflicting momentum and oscillator signals; while the overbought Stochastic RSI may hint at short-term bullish exhaustion, the low RSI signals persistent weakness. Bull/Bear Power points to slight buyer dominance intraday, which matches the daily advance of 7.5% ($0.0072), with no opening gap since today’s open was $0.0998 (compared with the previous close of $0.096); the price is now near the upper end of today’s range, reflecting high volatility and strength toward intraday highs — although broader momentum indicators do not fully confirm this rally.
Bearish bias holds as consolidation persists within volatility band
For the next five trading days, the price is most likely to fluctuate between $0.092 and $0.113, keeping it within about ±10% of the current level, forming a typical volatility band relative to current levels. The probability of a sustained price increase is very low (less than 20%), with a price decrease much more likely given the persistent bearish signals across the weekly indicators. The baseline scenario envisions the price consolidating around current levels in a sideways corridor. A bullish scenario would require a breakout above immediate resistance at $0.1124, while renewed selling could drive the price below support near $0.092 if negative momentum intensifies.
Last time, analysts noted that Arbitrum remains under pressure, trading below major moving averages with persistent bearish momentum reflected by negative MACD and RSI in selling territory. Immediate resistance is identified near $0.1132 and support around $0.0981, signaling ongoing downside risk and the likelihood of continued rangebound movement amid weak demand and elevated selling activity.


-
 Afghanistan
-
 Albania
-
 Algeria
-
 Angola
-
 Argentina
-
 Armenia
-
 Australia
-
 Austria
-
 Azerbaijan
-
 Bahamas
-
 Bahrain
-
 Bangladesh
-
 Belarus
-
 Belgium
-
 Bolivia
-
 Botswana
-
 Brazil
-
 Brunei
-
 Bulgaria
-
 Cambodia
-
 Cameroon
-
 Canada
-
 Chile
Chile
-
 China
China
-
 Colombia
-
 Congo
Congo
-
 Costa Rica
-
 Cote d'Ivoire
-
 Croatia
-
 Cuba
Cuba
-
 Cyprus
-
 Czechia
-
 DR Congo
-
 Denmark
-
 Dominican Republic
-
 Ecuador
-
 Egypt
Egypt
-
 El Salvador
-
 Estonia
-
 Eswatini
-
 Ethiopia
-
 Finland
-
 France
-
 Georgia
-
 Germany
-
 Ghana
Ghana
-
 Greece
-
 Haiti
Haiti
-
 Hong Kong
-
 Hungary
-
 India
India
-
 Indonesia
-
 Iran, Islamic republic
-
 Iraq
Iraq
-
 Ireland
-
 Israel
-
 Italy
Italy
-
 Jamaica
-
 Japan
Japan
-
 Jordan
-
 Kazakhstan
-
 Kenya
Kenya
-
 Korea
Korea
-
 Kuwait
-
 Kyrgyzstan
-
 Laos
Laos
-
 Latvia
-
 Lebanon
-
 Lesotho
-
 Libya
Libya
-
 Lithuania
-
 Luxembourg
-
 Madagascar
-
 Malaysia
-
 Malta
Malta
-
 Mauritius
-
 Mexico
-
 Moldova
-
 Mongolia
-
 Montenegro
-
 Morocco
-
 Mozambique
-
 Myanmar
-
 Namibia
-
 Nepal
Nepal
-
 Netherlands
-
 New Zealand
-
 Nigeria
-
 North Macedonia
-
 Norway
-
 Oman
Oman
-
 Pakistan
-
 Palestine
-
 Panama
-
 Papua New Guinea
-
 Paraguay
-
 Peru
Peru
-
 Philippines
-
 Poland
-
 Portugal
-
 Puerto Rico
-
 Qatar
Qatar
-
 Reunion
-
 Romania
-
 Rwanda
-
 Saudi Arabia
-
 Serbia
-
 Singapore
-
 Slovakia
-
 Slovenia
-
 Somalia
-
 South Africa
-
 Spain
Spain
-
 Sri Lanka
-
 Sweden
-
 Switzerland
-
 Syria
Syria
-
 Taiwan
-
 Tajikistan
-
 Tanzania
-
 Thailand
-
 Trinidad and Tobago
-
 Tunisia
-
 Turkey
-
 UAE
UAE
-
 Uganda
-
 Ukraine
-
 United Kingdom
-
United States
-
 Uruguay
-
 Uzbekistan
-
 Venezuela
-
 Vietnam
-
 Yemen
Yemen
-
 Zambia
-
 Zimbabwe
- Forex
- Crypto
