
Fetch.ai price prediction: Bearish bias persists as FET struggles near lows

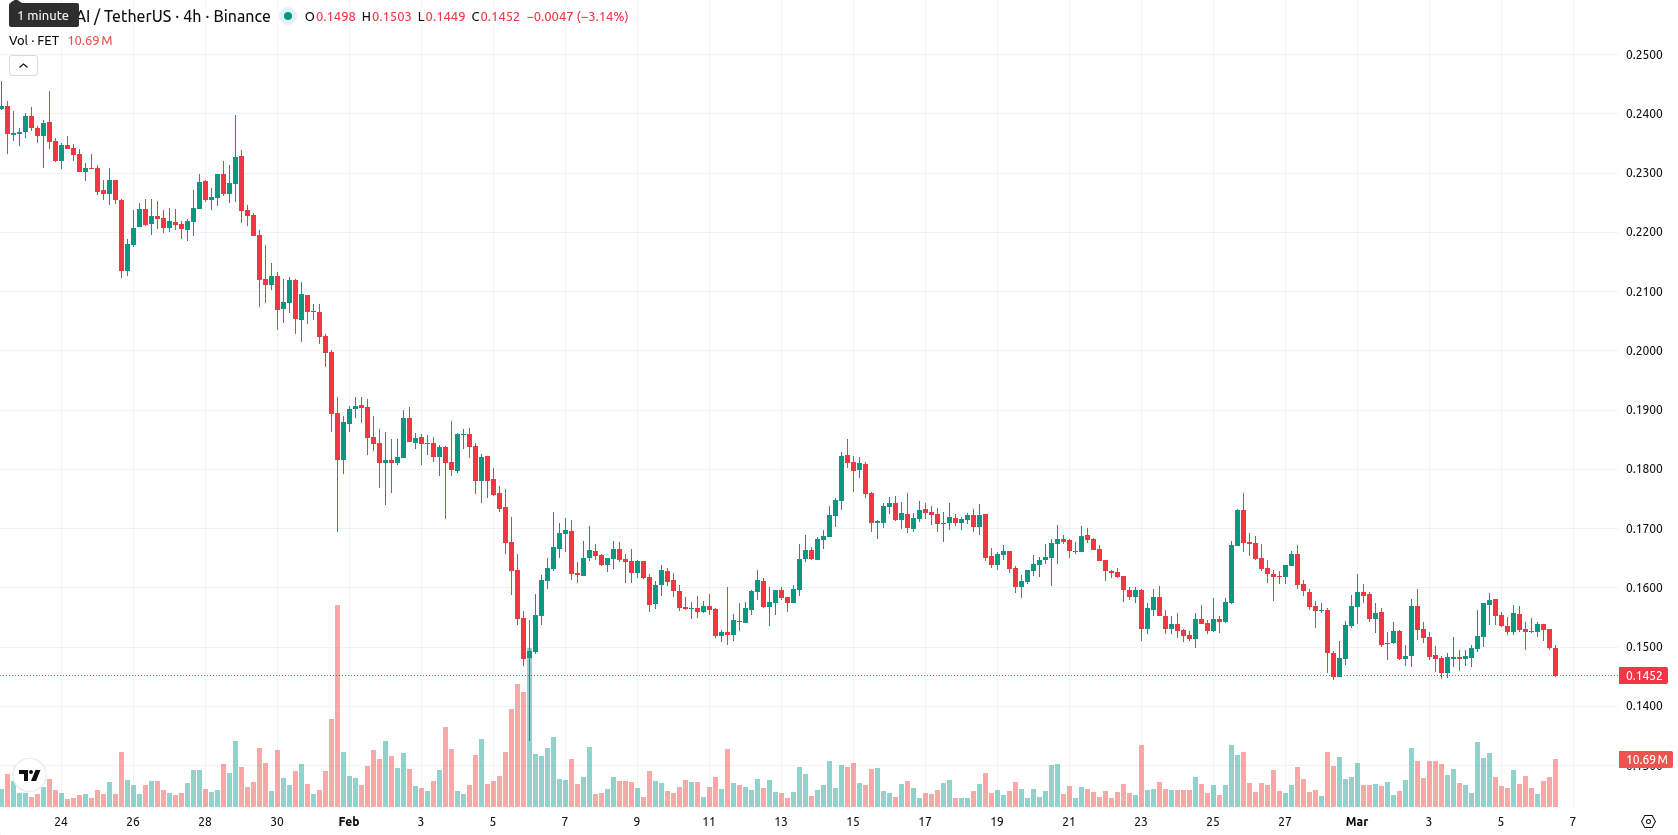
Fetch.ai (FET) is trading at $0.1451, down 7.11% for the day and holding below its MA-20 ($0.1613), MA-50 ($0.1881), and MA-200 ($0.3394), highlighting continued downside momentum across all major timeframes.
Highlights
- FET is trading significantly below major moving averages, confirming persistent downside momentum across all timeframes.
- Technical indicators reflect a strong bearish trend with oversold readings, minimal signs of recovery, and dominant seller pressure intraday.
- FET is expected to range between $0.130–$0.155 over the next five days, with risk skewed toward further declines unless resistance at $0.1647 is broken.
Bearish momentum and resistance reinforce downside pressure across timeframes
The current price of FET at $0.1451 is trading well below the MA-20 ($0.1613), MA-50 ($0.1881), and MA-200 ($0.3394), indicating persistent downside pressure in short-, medium-, and long-term trends. The Ichimoku Kijun level at $0.1647 stands above the market and acts as immediate resistance. Momentum signals are decidedly bearish, as both MACD and ADX suggest strong selling pressure without trend exhaustion. RSI (40.8) and CCI (-76.2) indicate mild to moderate oversold conditions, and Stochastic RSI sits at a neutral reading but is oversold across shorter timeframes, highlighting a lack of recovery attempts. Bull/Bear Power shows a slight buyer presence on D1, but the indicator and other oscillators reflect persistent seller dominance intraday. Daily performance confirms the bearish tone, with no significant gap at the open and the price dropping 7.11% to the lower end of its range near today’s low ($0.145). Intraday volatility is moderate to high, and continued pressure after the open aligns with negative momentum signals, though a short-term divergence with Bull/Bear Power is noted.
Sideways bias as consolidation faces persistent bearish signals
For the next 5 trading days, the expected price range is adjusted to $0.130–$0.155 to reflect current volatility and the typical volatility band relative to current levels, with sideways trading favored. The probability of an increase is very low (less than 20%), making a decrease much more likely. In the baseline scenario, FET consolidates within this corridor as oversold signals contend with persistent bearish momentum. The bullish scenario would require a break above the immediate resistance at $0.1647, but upward potential appears limited. In the bearish scenario, a sustained drop below $0.130 may accelerate further declines due to weak support and momentum favoring sellers.
Last time, analysts noted that Fetch.ai remains in a bearish trend, trading below key moving averages, with momentum indicators such as the MACD and ADX signaling persistent negative momentum and the RSI approaching oversold levels. Immediate resistance is seen at the Ichimoku Kijun, and the asset is expected to consolidate within a lower volatility band, with limited prospects for a near-term rebound unless resistance levels are decisively breached.


Latest FET News


-
 Afghanistan
-
 Albania
-
 Algeria
-
 Angola
-
 Argentina
-
 Armenia
-
 Australia
-
 Austria
-
 Azerbaijan
-
 Bahamas
-
 Bahrain
-
 Bangladesh
-
 Belarus
-
 Belgium
-
 Bolivia
-
 Botswana
-
 Brazil
-
 Brunei
-
 Bulgaria
-
 Cambodia
-
 Cameroon
-
 Canada
-
 Chile
Chile
-
 China
China
-
 Colombia
-
 Congo
Congo
-
 Costa Rica
-
 Cote d'Ivoire
-
 Croatia
-
 Cuba
Cuba
-
 Cyprus
-
 Czechia
-
 DR Congo
-
 Denmark
-
 Dominican Republic
-
 Ecuador
-
 Egypt
Egypt
-
 El Salvador
-
 Estonia
-
 Eswatini
-
 Ethiopia
-
 Finland
-
 France
-
 Georgia
-
 Germany
-
 Ghana
Ghana
-
 Greece
-
 Haiti
Haiti
-
 Hong Kong
-
 Hungary
-
 India
India
-
 Indonesia
-
 Iran, Islamic republic
-
 Iraq
Iraq
-
 Ireland
-
 Israel
-
 Italy
Italy
-
 Jamaica
-
 Japan
Japan
-
 Jordan
-
 Kazakhstan
-
 Kenya
Kenya
-
 Korea
Korea
-
 Kuwait
-
 Kyrgyzstan
-
 Laos
Laos
-
 Latvia
-
 Lebanon
-
 Lesotho
-
 Libya
Libya
-
 Lithuania
-
 Luxembourg
-
 Madagascar
-
 Malaysia
-
 Malta
Malta
-
 Mauritius
-
 Mexico
-
 Moldova
-
 Mongolia
-
 Montenegro
-
 Morocco
-
 Mozambique
-
 Myanmar
-
 Namibia
-
 Nepal
Nepal
-
 Netherlands
-
 New Zealand
-
 Nigeria
-
 North Macedonia
-
 Norway
-
 Oman
Oman
-
 Pakistan
-
 Palestine
-
 Panama
-
 Papua New Guinea
-
 Paraguay
-
 Peru
Peru
-
 Philippines
-
 Poland
-
 Portugal
-
 Puerto Rico
-
 Qatar
Qatar
-
 Reunion
-
 Romania
-
 Rwanda
-
 Saudi Arabia
-
 Serbia
-
 Singapore
-
 Slovakia
-
 Slovenia
-
 Somalia
-
 South Africa
-
 Spain
Spain
-
 Sri Lanka
-
 Sweden
-
 Switzerland
-
 Syria
Syria
-
 Taiwan
-
 Tajikistan
-
 Tanzania
-
 Thailand
-
 Trinidad and Tobago
-
 Tunisia
-
 Turkey
-
 UAE
UAE
-
 Uganda
-
 Ukraine
-
 United Kingdom
-
United States
-
 Uruguay
-
 Uzbekistan
-
 Venezuela
-
 Vietnam
-
 Yemen
Yemen
-
 Zambia
-
 Zimbabwe
- Forex
- Crypto
