
Flow price prediction: High volatility and resistance in focus? FLOW gains 18.91%

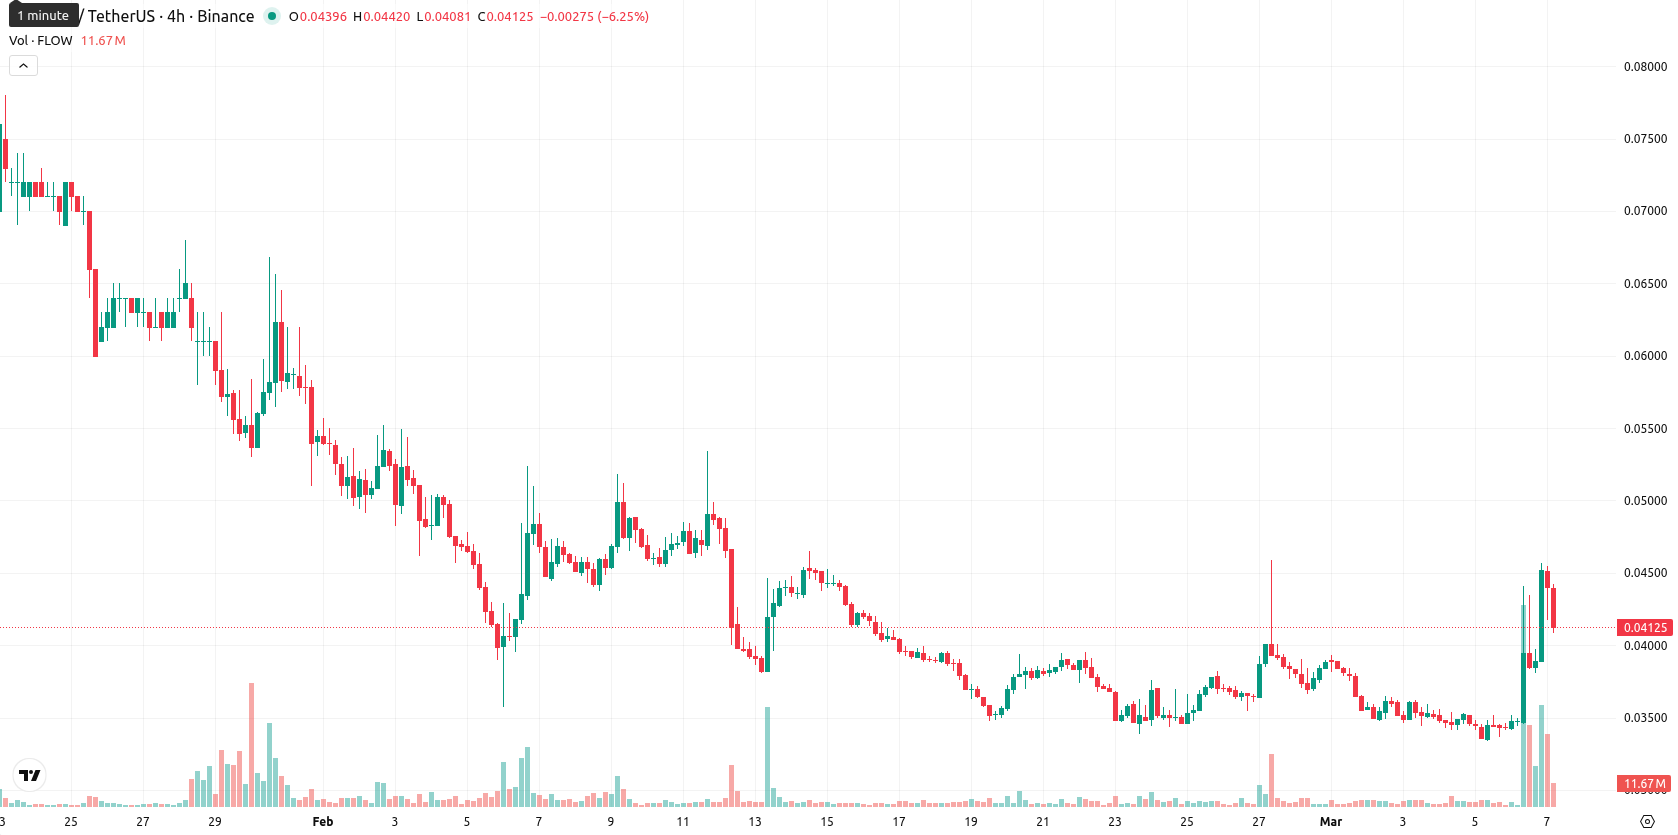
Flow (FLOW) is trading at $0.0415, above the MA-20 ($0.0374) but below the MA-50 ($0.0502) and well under the MA-200 ($0.2163). This setup suggests the short-term trend is positive while the medium- and long-term structures remain under bearish pressure.
Highlights
- FLOW shows a short-term positive trend but remains under medium- and long-term bearish pressure, reflecting cautious sentiment.
- Momentum indicators are mixed, with near-term buyer strength but signs of overbought exhaustion and persistent weekly bearish signals.
- Critical resistance stands at $0.0426, with price likely to consolidate between $0.0370 and $0.0460 barring a breakout.
Split momentum signals as volatility and buyer strength converge
Momentum signals are divergent on the daily chart. The MACD points to strong bearish momentum, but the ADX indicates buyers have the upper hand, and the RSI reads slightly bullish at 55. The Stochastic RSI and Commodity Channel Index both show overbought conditions, hinting at possible short-term exhaustion, while Bull/Bear Power signals strong buyer dominance intraday. Despite the mixed momentum readings, the Awesome Oscillator is neutral. After gapping up from $0.0349 to the $0.045 opening, the price has risen 18.91% and currently sits just below today’s high in a $0.0408–$0.0454 range, reflecting high intraday volatility and clear buying strength after the open.
Bearish tilt dominates near-term as weak momentum limits rebound
For the coming week, the expected normalized price range is $0.0370 to $0.0460. The probability of a price increase is very low (less than 20%), making further declines more likely based on persistent sell signals from weekly indicators. The baseline scenario is for sideways movement just below resistance. A bullish outcome would require breaking above $0.0426, opening potential for a test toward $0.0460, while a bearish break below $0.0370 could trigger renewed downside toward the weekly low.
Last time, analysts noted that Flow (FLOW) was showing short-term strength, trading above its MA-20 but still below the MA-50 and MA-200, indicating ongoing broader bearish momentum. Momentum indicators such as MACD and ADX remained bearish despite a sharp intraday gain, while resistance near the MA-50 and immediate support at the Ichimoku Kijun highlight caution amid high volatility and persistent seller dominance.


-
 Afghanistan
-
 Albania
-
 Algeria
-
 Angola
-
 Argentina
-
 Armenia
-
 Australia
-
 Austria
-
 Azerbaijan
-
 Bahamas
-
 Bahrain
-
 Bangladesh
-
 Belarus
-
 Belgium
-
 Bolivia
-
 Botswana
-
 Brazil
-
 Brunei
-
 Bulgaria
-
 Cambodia
-
 Cameroon
-
 Canada
-
 Chile
Chile
-
 China
China
-
 Colombia
-
 Congo
Congo
-
 Costa Rica
-
 Cote d'Ivoire
-
 Croatia
-
 Cuba
Cuba
-
 Cyprus
-
 Czechia
-
 DR Congo
-
 Denmark
-
 Dominican Republic
-
 Ecuador
-
 Egypt
Egypt
-
 El Salvador
-
 Estonia
-
 Eswatini
-
 Ethiopia
-
 Finland
-
 France
-
 Georgia
-
 Germany
-
 Ghana
Ghana
-
 Greece
-
 Haiti
Haiti
-
 Hong Kong
-
 Hungary
-
 India
India
-
 Indonesia
-
 Iran, Islamic republic
-
 Iraq
Iraq
-
 Ireland
-
 Israel
-
 Italy
Italy
-
 Jamaica
-
 Japan
Japan
-
 Jordan
-
 Kazakhstan
-
 Kenya
Kenya
-
 Korea
Korea
-
 Kuwait
-
 Kyrgyzstan
-
 Laos
Laos
-
 Latvia
-
 Lebanon
-
 Lesotho
-
 Libya
Libya
-
 Lithuania
-
 Luxembourg
-
 Madagascar
-
 Malaysia
-
 Malta
Malta
-
 Mauritius
-
 Mexico
-
 Moldova
-
 Mongolia
-
 Montenegro
-
 Morocco
-
 Mozambique
-
 Myanmar
-
 Namibia
-
 Nepal
Nepal
-
 Netherlands
-
 New Zealand
-
 Nigeria
-
 North Macedonia
-
 Norway
-
 Oman
Oman
-
 Pakistan
-
 Palestine
-
 Panama
-
 Papua New Guinea
-
 Paraguay
-
 Peru
Peru
-
 Philippines
-
 Poland
-
 Portugal
-
 Puerto Rico
-
 Qatar
Qatar
-
 Reunion
-
 Romania
-
 Rwanda
-
 Saudi Arabia
-
 Serbia
-
 Singapore
-
 Slovakia
-
 Slovenia
-
 Somalia
-
 South Africa
-
 Spain
Spain
-
 Sri Lanka
-
 Sweden
-
 Switzerland
-
 Syria
Syria
-
 Taiwan
-
 Tajikistan
-
 Tanzania
-
 Thailand
-
 Trinidad and Tobago
-
 Tunisia
-
 Turkey
-
 UAE
UAE
-
 Uganda
-
 Ukraine
-
 United Kingdom
-
United States
-
 Uruguay
-
 Uzbekistan
-
 Venezuela
-
 Vietnam
-
 Yemen
Yemen
-
 Zambia
-
 Zimbabwe
- Forex
- Crypto
