
Flow price prediction: Will resistance hold as FLOW falls deeper below key averages?

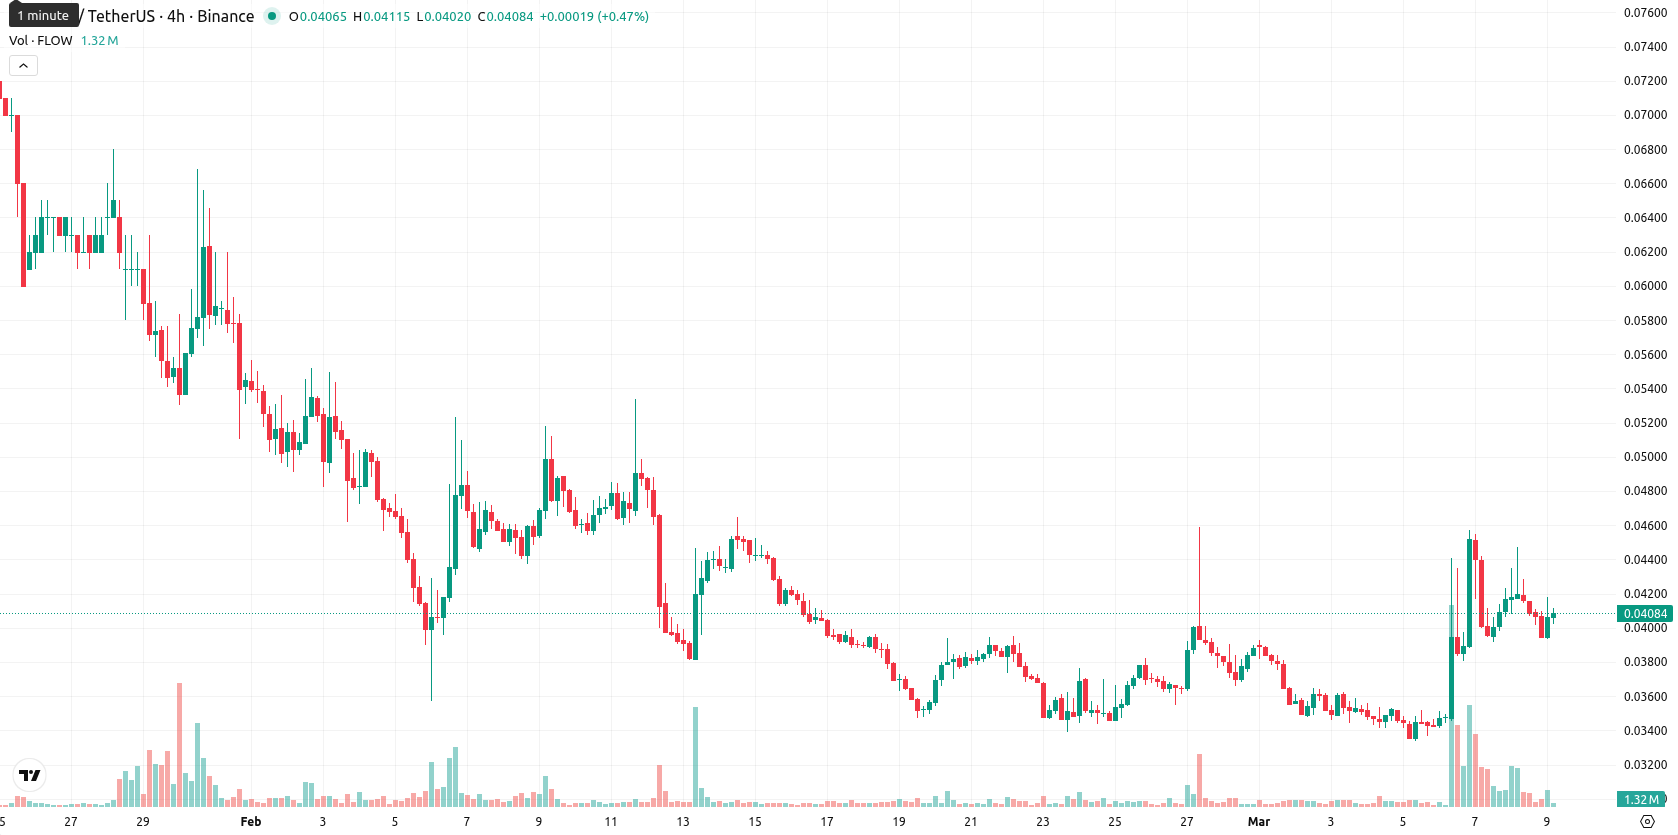
Flow (FLOW) is trading at $0.0409 after falling 7.47% today. The price sits above its MA-20 ($0.0374), signaling short-term bullish momentum, but remains under both the MA-50 ($0.0483) and well beneath the MA-200 ($0.2130), indicating ongoing medium- and long-term selling pressure.
Highlights
- FLOW trades above short-term averages, but remains under heavy medium- and long-term technical pressure from sellers.
- Momentum indicators are mixed with bearish signals and short-term overbought readings, signaling potential for continued downside.
- Expected range for the next five sessions is $0.0370–$0.0425, with low odds of sustained upward movement.
Mixed momentum and resistance challenge near Ichimoku Kijun
Technically, FLOW faces immediate resistance from the Ichimoku Kijun at $0.0417. While the ADX is classified as "Buy" and Bull/Bear Power is slightly positive, momentum shows mixed signals: the daily MACD reflects strong bearish momentum, RSI is just under neutral at 46.91, and the Stochastic RSI and CCI both indicate "Sell" and "Overbought" conditions. The Awesome Oscillator is neutral, and recent price action has been negative with moderate intraday volatility, leaving FLOW around the middle of today's trading range ($0.0394 – $0.0417).
Downside risk prevails as breakout hurdles remain
Over the next five trading days, the expected price range for FLOW is $0.0370 to $0.0425, setting a typical volatility band relative to current levels. There is a very low probability (less than 20%) of a sustained price increase, with further downside more likely. The baseline scenario anticipates price movement between current support and resistance. A bullish breakout would need to clear $0.0417, while a fall below $0.0370 could trigger continued short-term weakness.
Previously it was reported that Flow is exhibiting short-term bullish momentum as it trades above its 20-day moving average but remains constrained by resistance at the 50-day and 200-day moving averages, indicating ongoing medium- and long-term bearish pressure. Mixed technical signals—including a strong ADX trend, bearish MACD, and overbought oscillators—suggest heightened volatility and possible profit-taking, with immediate support near $0.0417 and resistance around $0.0460.


Latest FLOW News


-
 Afghanistan
-
 Albania
-
 Algeria
-
 Angola
-
 Argentina
-
 Armenia
-
 Australia
-
 Austria
-
 Azerbaijan
-
 Bahamas
-
 Bahrain
-
 Bangladesh
-
 Belarus
-
 Belgium
-
 Bolivia
-
 Botswana
-
 Brazil
-
 Brunei
-
 Bulgaria
-
 Cambodia
-
 Cameroon
-
 Canada
-
 Chile
Chile
-
 China
China
-
 Colombia
-
 Congo
Congo
-
 Costa Rica
-
 Cote d'Ivoire
-
 Croatia
-
 Cuba
Cuba
-
 Cyprus
-
 Czechia
-
 DR Congo
-
 Denmark
-
 Dominican Republic
-
 Ecuador
-
 Egypt
Egypt
-
 El Salvador
-
 Estonia
-
 Eswatini
-
 Ethiopia
-
 Finland
-
 France
-
 Georgia
-
 Germany
-
 Ghana
Ghana
-
 Greece
-
 Haiti
Haiti
-
 Hong Kong
-
 Hungary
-
 India
India
-
 Indonesia
-
 Iran, Islamic republic
-
 Iraq
Iraq
-
 Ireland
-
 Israel
-
 Italy
Italy
-
 Jamaica
-
 Japan
Japan
-
 Jordan
-
 Kazakhstan
-
 Kenya
Kenya
-
 Korea
Korea
-
 Kuwait
-
 Kyrgyzstan
-
 Laos
Laos
-
 Latvia
-
 Lebanon
-
 Lesotho
-
 Libya
Libya
-
 Lithuania
-
 Luxembourg
-
 Madagascar
-
 Malaysia
-
 Malta
Malta
-
 Mauritius
-
 Mexico
-
 Moldova
-
 Mongolia
-
 Montenegro
-
 Morocco
-
 Mozambique
-
 Myanmar
-
 Namibia
-
 Nepal
Nepal
-
 Netherlands
-
 New Zealand
-
 Nigeria
-
 North Macedonia
-
 Norway
-
 Oman
Oman
-
 Pakistan
-
 Palestine
-
 Panama
-
 Papua New Guinea
-
 Paraguay
-
 Peru
Peru
-
 Philippines
-
 Poland
-
 Portugal
-
 Puerto Rico
-
 Qatar
Qatar
-
 Reunion
-
 Romania
-
 Rwanda
-
 Saudi Arabia
-
 Serbia
-
 Singapore
-
 Slovakia
-
 Slovenia
-
 Somalia
-
 South Africa
-
 Spain
Spain
-
 Sri Lanka
-
 Sweden
-
 Switzerland
-
 Syria
Syria
-
 Taiwan
-
 Tajikistan
-
 Tanzania
-
 Thailand
-
 Trinidad and Tobago
-
 Tunisia
-
 Turkey
-
 UAE
UAE
-
 Uganda
-
 Ukraine
-
 United Kingdom
-
United States
-
 Uruguay
-
 Uzbekistan
-
 Venezuela
-
 Vietnam
-
 Yemen
Yemen
-
 Zambia
-
 Zimbabwe
- Forex
- Crypto
