
Flow price prediction: Momentum conflict ahead? FLOW gains 7.11% but faces resistance

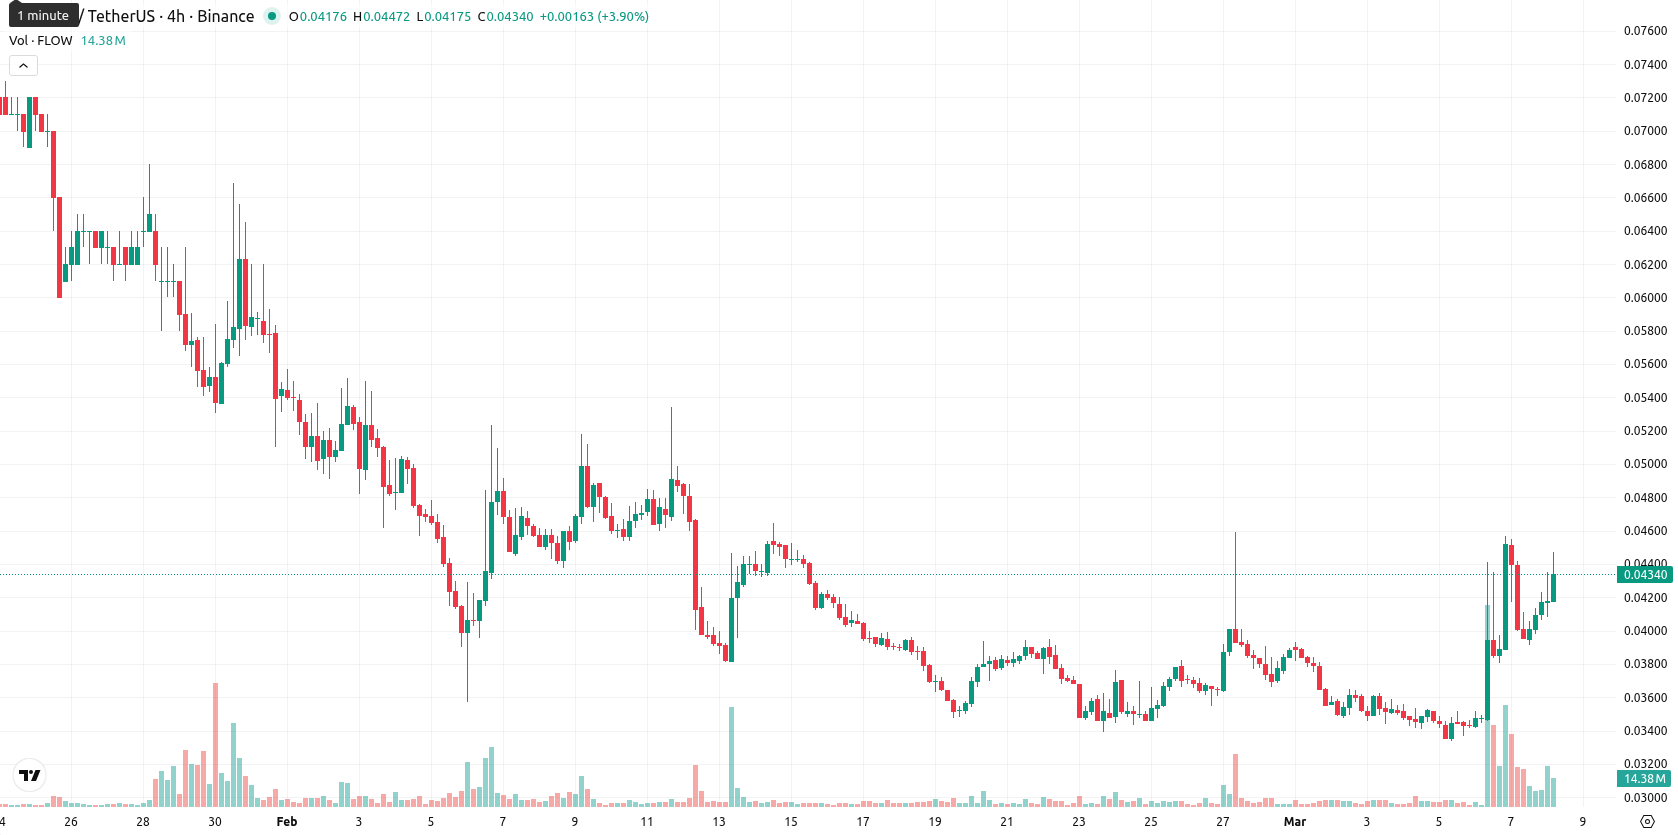
Flow (FLOW) is trading at $0.0437, rising 7.11% on the day. The asset is now positioned above its MA-20 ($0.0374) but remains below the MA-50 ($0.0492) and well under the MA-200 ($0.2147).
Highlights
- FLOW maintains a weak long-term trend, trading below key moving averages despite recent short-term upside momentum.
- Technical signals are mixed, with short-term buying activity challenged by overbought conditions and conflicting momentum indicators.
- FLOW is likely to trade between $0.0410 and $0.0460 over the next five days, with downside pressure dominating unless buyers break above $0.0460.
Bullish momentum faces resistance as mixed signals emerge
FLOW is trading above both its MA-20 ($0.0374) but below the MA-50 ($0.0492) and well below the MA-200 ($0.2147). This setup suggests a strengthening short-term trend, continued medium-term overhead pressure, and a long-term bearish structure is still intact. The Ichimoku Kijun at $0.0417 is below the current price, indicating immediate support in the near term. Momentum signals on the daily chart are mixed. Average Directional Index shows strong trend activity with a Buy forecast, while MACD remains in Strong Sell territory, highlighting a momentum divergence. RSI is near neutral with a mild bullish bias, and Commodity Channel Index in overbought territory hints at potential profit-taking ahead. Stochastic RSI is also in the neutral-to-overbought zone. Bull/Bear Power points to buyers dominating intraday momentum, and the Awesome Oscillator is neutral, providing no added confirmation. Today, FLOW opened with a small upward gap, is currently trading near the upper end of its daily range, has seen high intraday volatility, and maintains strength toward the highs after the open — matching the buyer-driven tone from Bull/Bear Power, although momentum indicators show some internal conflict.
Downside risk dominates as weekly momentum deters sustained rally
For the next five trading days, FLOW is likely to fluctuate between $0.0410 and $0.0460, adjusted as a volatility band relative to current levels. The probability of further price gains is very low (less than 20%), with a decline more likely, as most weekly momentum and trend indicators (RSI, ADX, MACD, and MA-50 on W1) point to persistent downward pressure. Baseline scenario: price moves sideways within this corridor as buyer interest contends with broader weakness. Bullish scenario: a clear break above $0.0460 could trigger further gains if short-term strength prevails. Bearish scenario: a drop below $0.0410 would signal renewed selling and risk a test of lower levels.
Previously it was reported that Flow (FLOW) is exhibiting short-term bullish momentum, trading above its 20-day moving average but remaining below the 50-day and 200-day moving averages, signaling ongoing caution in medium- and long-term trends. Mixed technical indicators—including a bearish MACD, strong ADX buy signal, neutral RSI, and overbought readings on Stoch RSI and CCI—suggest heightened volatility near resistance, with immediate support at the MA-20 and resistance at the Ichimoku Kijun.


-
 Afghanistan
-
 Albania
-
 Algeria
-
 Angola
-
 Argentina
-
 Armenia
-
 Australia
-
 Austria
-
 Azerbaijan
-
 Bahamas
-
 Bahrain
-
 Bangladesh
-
 Belarus
-
 Belgium
-
 Bolivia
-
 Botswana
-
 Brazil
-
 Brunei
-
 Bulgaria
-
 Cambodia
-
 Cameroon
-
 Canada
-
 Chile
Chile
-
 China
China
-
 Colombia
-
 Congo
Congo
-
 Costa Rica
-
 Cote d'Ivoire
-
 Croatia
-
 Cuba
Cuba
-
 Cyprus
-
 Czechia
-
 DR Congo
-
 Denmark
-
 Dominican Republic
-
 Ecuador
-
 Egypt
Egypt
-
 El Salvador
-
 Estonia
-
 Eswatini
-
 Ethiopia
-
 Finland
-
 France
-
 Georgia
-
 Germany
-
 Ghana
Ghana
-
 Greece
-
 Haiti
Haiti
-
 Hong Kong
-
 Hungary
-
 India
India
-
 Indonesia
-
 Iran, Islamic republic
-
 Iraq
Iraq
-
 Ireland
-
 Israel
-
 Italy
Italy
-
 Jamaica
-
 Japan
Japan
-
 Jordan
-
 Kazakhstan
-
 Kenya
Kenya
-
 Korea
Korea
-
 Kuwait
-
 Kyrgyzstan
-
 Laos
Laos
-
 Latvia
-
 Lebanon
-
 Lesotho
-
 Libya
Libya
-
 Lithuania
-
 Luxembourg
-
 Madagascar
-
 Malaysia
-
 Malta
Malta
-
 Mauritius
-
 Mexico
-
 Moldova
-
 Mongolia
-
 Montenegro
-
 Morocco
-
 Mozambique
-
 Myanmar
-
 Namibia
-
 Nepal
Nepal
-
 Netherlands
-
 New Zealand
-
 Nigeria
-
 North Macedonia
-
 Norway
-
 Oman
Oman
-
 Pakistan
-
 Palestine
-
 Panama
-
 Papua New Guinea
-
 Paraguay
-
 Peru
Peru
-
 Philippines
-
 Poland
-
 Portugal
-
 Puerto Rico
-
 Qatar
Qatar
-
 Reunion
-
 Romania
-
 Rwanda
-
 Saudi Arabia
-
 Serbia
-
 Singapore
-
 Slovakia
-
 Slovenia
-
 Somalia
-
 South Africa
-
 Spain
Spain
-
 Sri Lanka
-
 Sweden
-
 Switzerland
-
 Syria
Syria
-
 Taiwan
-
 Tajikistan
-
 Tanzania
-
 Thailand
-
 Trinidad and Tobago
-
 Tunisia
-
 Turkey
-
 UAE
UAE
-
 Uganda
-
 Ukraine
-
 United Kingdom
-
United States
-
 Uruguay
-
 Uzbekistan
-
 Venezuela
-
 Vietnam
-
 Yemen
Yemen
-
 Zambia
-
 Zimbabwe
- Forex
- Crypto
