
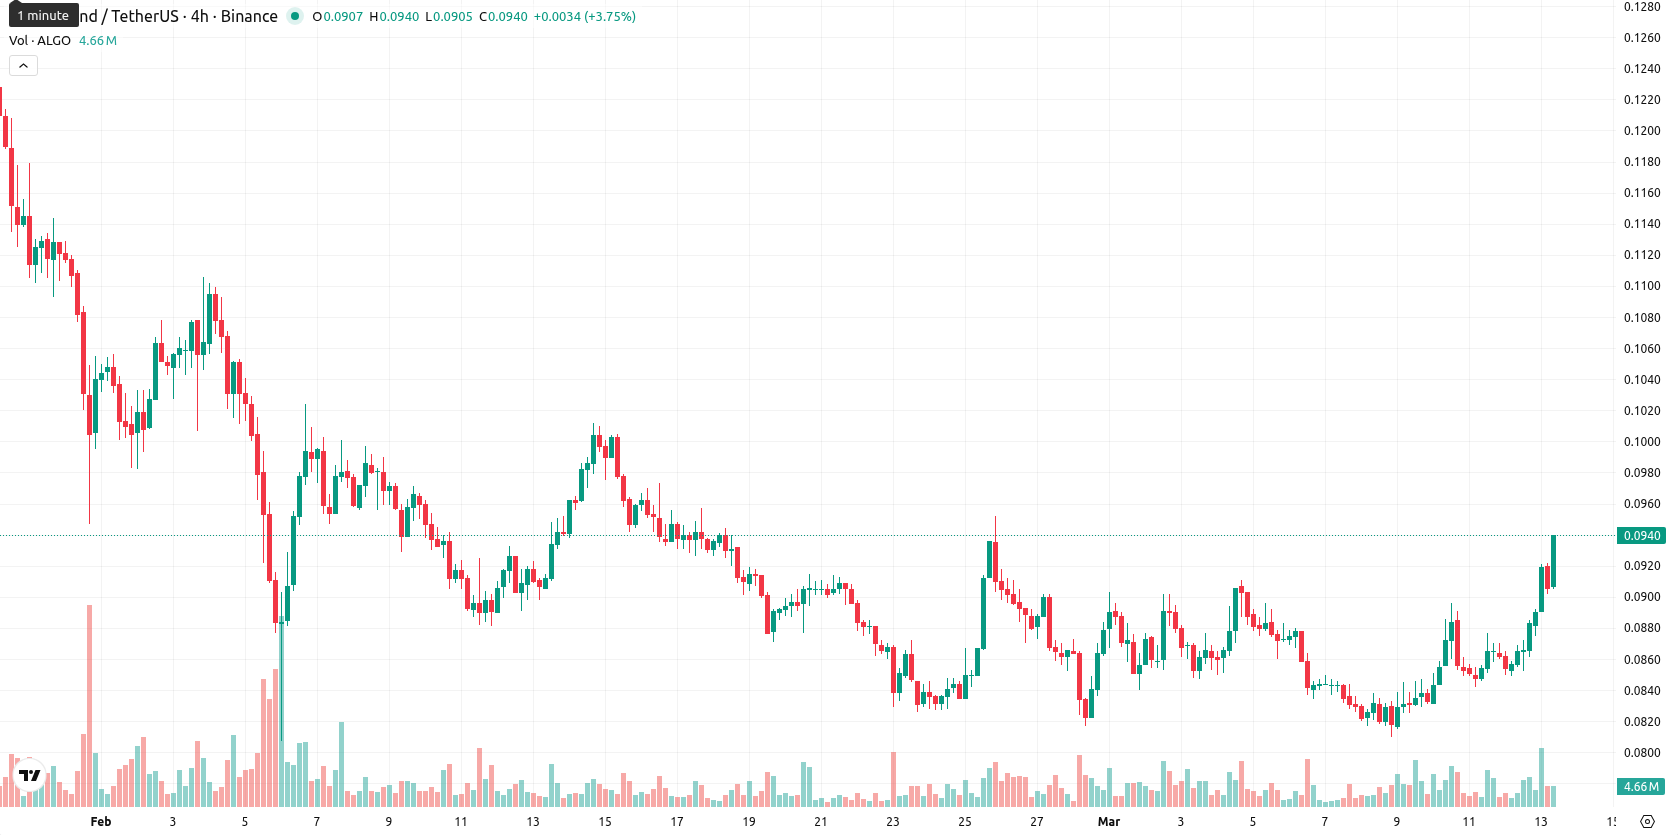
Short-term bullish signals meet resistance — Algorand gains 7.61%

Algorand (ALGO) is trading at $0.0933 after a daily increase of 7.61%. The price stands above the MA-20 ($0.0863), but remains below the MA-50 ($0.0963) and well beneath the MA-200 ($0.1536), indicating short-term bullish momentum, moderate medium-term resistance, and sustained long-term bearish bias. Immediate support is provided by the Ichimoku Kijun at $0.0908 just under the current level.
Highlights
- ALGO trades above its short-term average but remains below longer-term trend indicators, signaling unresolved directionality.
- Momentum indicators reflect mixed signals, with overbought oscillators and weakening trend suggesting limited upside potential.
- Price likely consolidates between $0.0840 and $0.1020 in the next five days, with a downward move favored if support breaks.
Momentum divergence surfaces with overbought oscillators and weak trend
Momentum signals are mixed for ALGO. The MACD on D1 signals a strong sell, while the ADX points to a weakening trend. The RSI holds neutral near 49, and the Stoch RSI is fully overbought, hinting at possible exhaustion. CCI is neutral and BBP shows persistent buyer pressure. After the day's strong move, ALGO trades near the high end of its intraday range amid notable volatility. There is a noticeable divergence, as short-term buying momentum clashes with a lack of medium-term trend conviction and overbought oscillators.
Downside risk prevails as breakout chances remain subdued
For the next five trading days, the anticipated price band is $0.0840–$0.1020 based on typical volatility at current levels. The probability of additional gains is low (less than 20%), making a retreat more likely. Baseline: ALGO consolidates between recent support and resistance. A break above $0.0963 could signal a move to the $0.10 zone, while a slide below the Ichimoku Kijun ($0.0908) and $0.0890 raises prospects of a retest near $0.0840.
Previously it was reported that Algorand is trading substantially below its major weekly moving averages with technical indicators—including RSI, MACD, and momentum oscillators—signaling ongoing bearish momentum and oversold conditions. The asset remains constrained within a defined range, with near-term support around $0.077 and resistance at $0.095, and a persistent downside risk unless a decisive reversal develops.


-
 Afghanistan
-
 Albania
-
 Algeria
-
 Angola
-
 Argentina
-
 Armenia
-
 Australia
-
 Austria
-
 Azerbaijan
-
 Bahamas
-
 Bahrain
-
 Bangladesh
-
 Belarus
-
 Belgium
-
 Bolivia
-
 Botswana
-
 Brazil
-
 Brunei
-
 Bulgaria
-
 Cambodia
-
 Cameroon
-
 Canada
-
 Chile
Chile
-
 China
China
-
 Colombia
-
 Congo
Congo
-
 Costa Rica
-
 Cote d'Ivoire
-
 Croatia
-
 Cuba
Cuba
-
 Cyprus
-
 Czechia
-
 DR Congo
-
 Denmark
-
 Dominican Republic
-
 Ecuador
-
 Egypt
Egypt
-
 El Salvador
-
 Estonia
-
 Eswatini
-
 Ethiopia
-
 Finland
-
 France
-
 Georgia
-
 Germany
-
 Ghana
Ghana
-
 Greece
-
 Haiti
Haiti
-
 Hong Kong
-
 Hungary
-
 India
India
-
 Indonesia
-
 Iran, Islamic republic
-
 Iraq
Iraq
-
 Ireland
-
 Israel
-
 Italy
Italy
-
 Jamaica
-
 Japan
Japan
-
 Jordan
-
 Kazakhstan
-
 Kenya
Kenya
-
 Korea
Korea
-
 Kuwait
-
 Kyrgyzstan
-
 Laos
Laos
-
 Latvia
-
 Lebanon
-
 Lesotho
-
 Libya
Libya
-
 Lithuania
-
 Luxembourg
-
 Madagascar
-
 Malaysia
-
 Malta
Malta
-
 Mauritius
-
 Mexico
-
 Moldova
-
 Mongolia
-
 Montenegro
-
 Morocco
-
 Mozambique
-
 Myanmar
-
 Namibia
-
 Nepal
Nepal
-
 Netherlands
-
 New Zealand
-
 Nigeria
-
 North Macedonia
-
 Norway
-
 Oman
Oman
-
 Pakistan
-
 Palestine
-
 Panama
-
 Papua New Guinea
-
 Paraguay
-
 Peru
Peru
-
 Philippines
-
 Poland
-
 Portugal
-
 Puerto Rico
-
 Qatar
Qatar
-
 Reunion
-
 Romania
-
 Rwanda
-
 Saudi Arabia
-
 Serbia
-
 Singapore
-
 Slovakia
-
 Slovenia
-
 Somalia
-
 South Africa
-
 Spain
Spain
-
 Sri Lanka
-
 Sweden
-
 Switzerland
-
 Syria
Syria
-
 Taiwan
-
 Tajikistan
-
 Tanzania
-
 Thailand
-
 Trinidad and Tobago
-
 Tunisia
-
 Turkey
-
 UAE
UAE
-
 Uganda
-
 Ukraine
-
 United Kingdom
-
United States
-
 Uruguay
-
 Uzbekistan
-
 Venezuela
-
 Vietnam
-
 Yemen
Yemen
-
 Zambia
-
 Zimbabwe
- Forex
- Crypto
