
Fetch.ai: Short-term support holds as technical strength drives gains

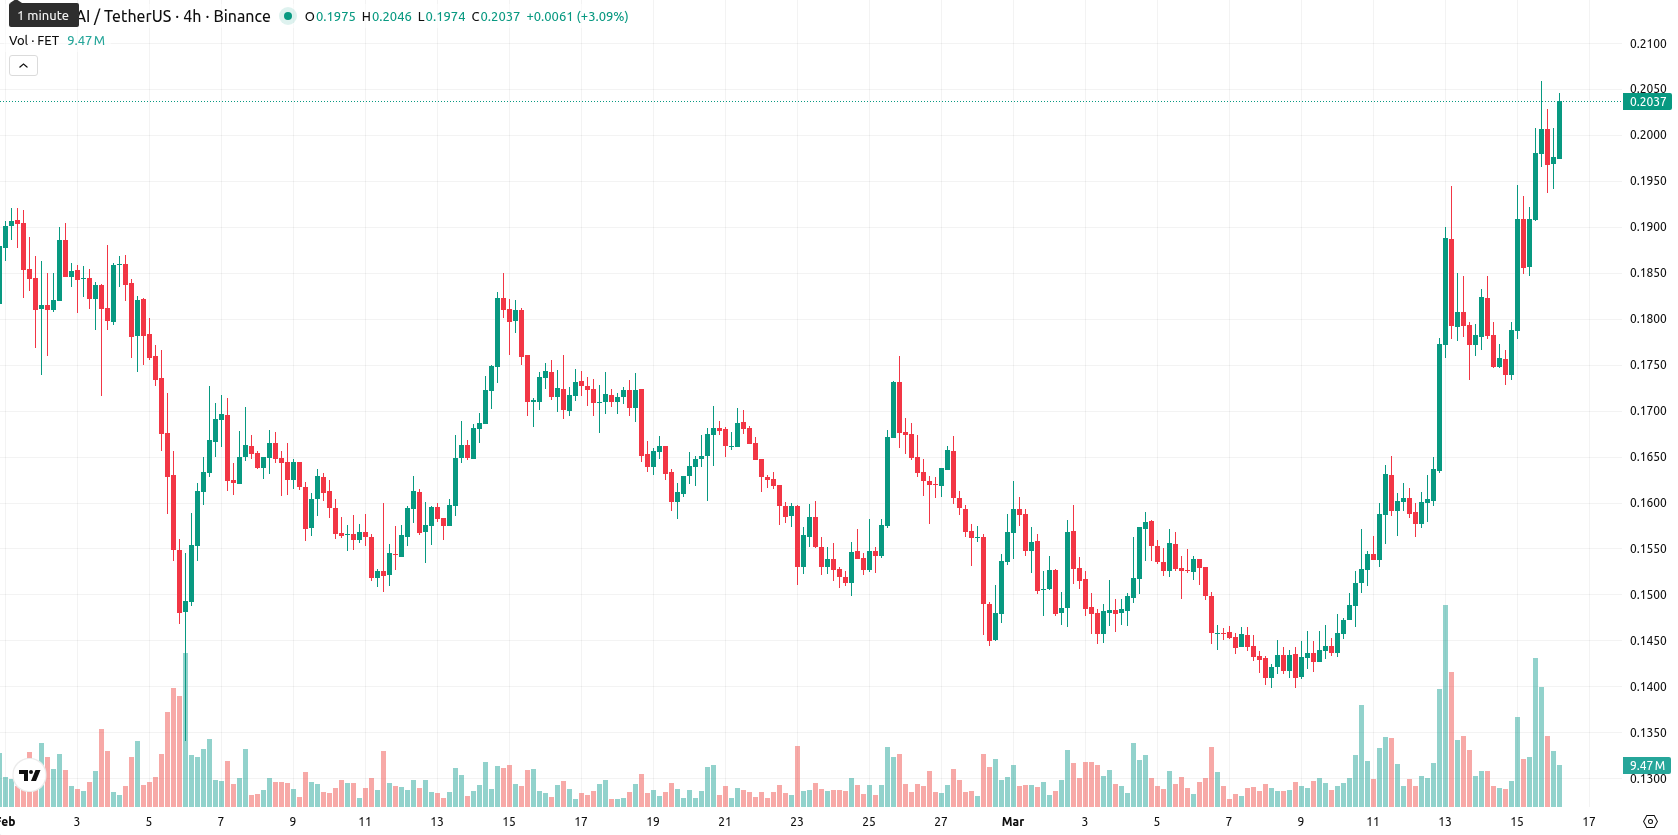
Fetch.ai (FET) is trading at $0.2033, up 8.54% today, with the price sitting comfortably above the SMA-20 ($0.1586) and SMA-50 ($0.1703). The asset remains under long-term pressure below the SMA-200 ($0.3141), but holds immediate support at the Ichimoku Kijun ($0.1729).
Highlights
- FET sustains a short- to medium-term bullish structure as price remains well above key short-term averages.
- Momentum is mixed with several overbought signals, suggesting an increased likelihood of a near-term pullback or sideways consolidation.
- Expected range for the coming week is $0.185–$0.215, with limited upside and support near $0.1729; downward movement is favored barring a breakout.
Bullish momentum meets overbought signals as volatility climbs
Momentum readings are mixed but tilt positive: MACD is neutral, while ADX at 25.24 reflects an emerging trend. RSI (68.1) and CCI (222.4) indicate overbought conditions, with Stoch RSI at 100 confirming short-term froth. Bull/Bear Power (BBP) signals strong intraday buyer dominance, and the Awesome Oscillator aligns with the current bull move. FET sits near the top of its daily range ($0.1941 – $0.2044), showing high volatility and sustained strength, though overbought signals suggest a potential near-term pause or pullback.
Downside risk prevails with weak upside odds and key support in play
In the short term, FET is likely to remain within a $0.185 – $0.215 volatility band relative to current levels, reflecting recent price swings. The probability of further upside is low (less than 20%), while downward movement is favored based on predominantly bearish signals from weekly MA-50, MA-100, MA-200, MACD, and RSI. Sideways trading within this band remains the baseline scenario, anchored by immediate support at the Kijun ($0.1729). A close above $0.215 would be needed to trigger a new bullish signal, while a drop below $0.185 could prompt deeper selling driven by overbought conditions.
Earlier, analysts noted that Fetch.ai maintained robust short- and medium-term momentum, though caution was advised due to signs of overbought market conditions and underlying long-term pressures. The latest readings reinforce this cautious outlook, with traders now advised to closely monitor for a decisive move beyond the well-defined $0.185–$0.215 range, as a breakout could set the stage for the next trend.


-
 Afghanistan
-
 Albania
-
 Algeria
-
 Angola
-
 Argentina
-
 Armenia
-
 Australia
-
 Austria
-
 Azerbaijan
-
 Bahamas
-
 Bahrain
-
 Bangladesh
-
 Belarus
-
 Belgium
-
 Bolivia
-
 Botswana
-
 Brazil
-
 Brunei
-
 Bulgaria
-
 Cambodia
-
 Cameroon
-
 Canada
-
 Chile
Chile
-
 China
China
-
 Colombia
-
 Congo
Congo
-
 Costa Rica
-
 Cote d'Ivoire
-
 Croatia
-
 Cuba
Cuba
-
 Cyprus
-
 Czechia
-
 DR Congo
-
 Denmark
-
 Dominican Republic
-
 Ecuador
-
 Egypt
Egypt
-
 El Salvador
-
 Estonia
-
 Eswatini
-
 Ethiopia
-
 Finland
-
 France
-
 Georgia
-
 Germany
-
 Ghana
Ghana
-
 Greece
-
 Haiti
Haiti
-
 Hong Kong
-
 Hungary
-
 India
India
-
 Indonesia
-
 Iran, Islamic republic
-
 Iraq
Iraq
-
 Ireland
-
 Israel
-
 Italy
Italy
-
 Jamaica
-
 Japan
Japan
-
 Jordan
-
 Kazakhstan
-
 Kenya
Kenya
-
 Korea
Korea
-
 Kuwait
-
 Kyrgyzstan
-
 Laos
Laos
-
 Latvia
-
 Lebanon
-
 Lesotho
-
 Libya
Libya
-
 Lithuania
-
 Luxembourg
-
 Madagascar
-
 Malaysia
-
 Malta
Malta
-
 Mauritius
-
 Mexico
-
 Moldova
-
 Mongolia
-
 Montenegro
-
 Morocco
-
 Mozambique
-
 Myanmar
-
 Namibia
-
 Nepal
Nepal
-
 Netherlands
-
 New Zealand
-
 Nigeria
-
 North Macedonia
-
 Norway
-
 Oman
Oman
-
 Pakistan
-
 Palestine
-
 Panama
-
 Papua New Guinea
-
 Paraguay
-
 Peru
Peru
-
 Philippines
-
 Poland
-
 Portugal
-
 Puerto Rico
-
 Qatar
Qatar
-
 Reunion
-
 Romania
-
 Rwanda
-
 Saudi Arabia
-
 Serbia
-
 Singapore
-
 Slovakia
-
 Slovenia
-
 Somalia
-
 South Africa
-
 Spain
Spain
-
 Sri Lanka
-
 Sweden
-
 Switzerland
-
 Syria
Syria
-
 Taiwan
-
 Tajikistan
-
 Tanzania
-
 Thailand
-
 Trinidad and Tobago
-
 Tunisia
-
 Turkey
-
 UAE
UAE
-
 Uganda
-
 Ukraine
-
 United Kingdom
-
United States
-
 Uruguay
-
 Uzbekistan
-
 Venezuela
-
 Vietnam
-
 Yemen
Yemen
-
 Zambia
-
 Zimbabwe
- Forex
- Crypto
