
+13.23% for Bonk — Intraday bullish tone despite weak weekly signals

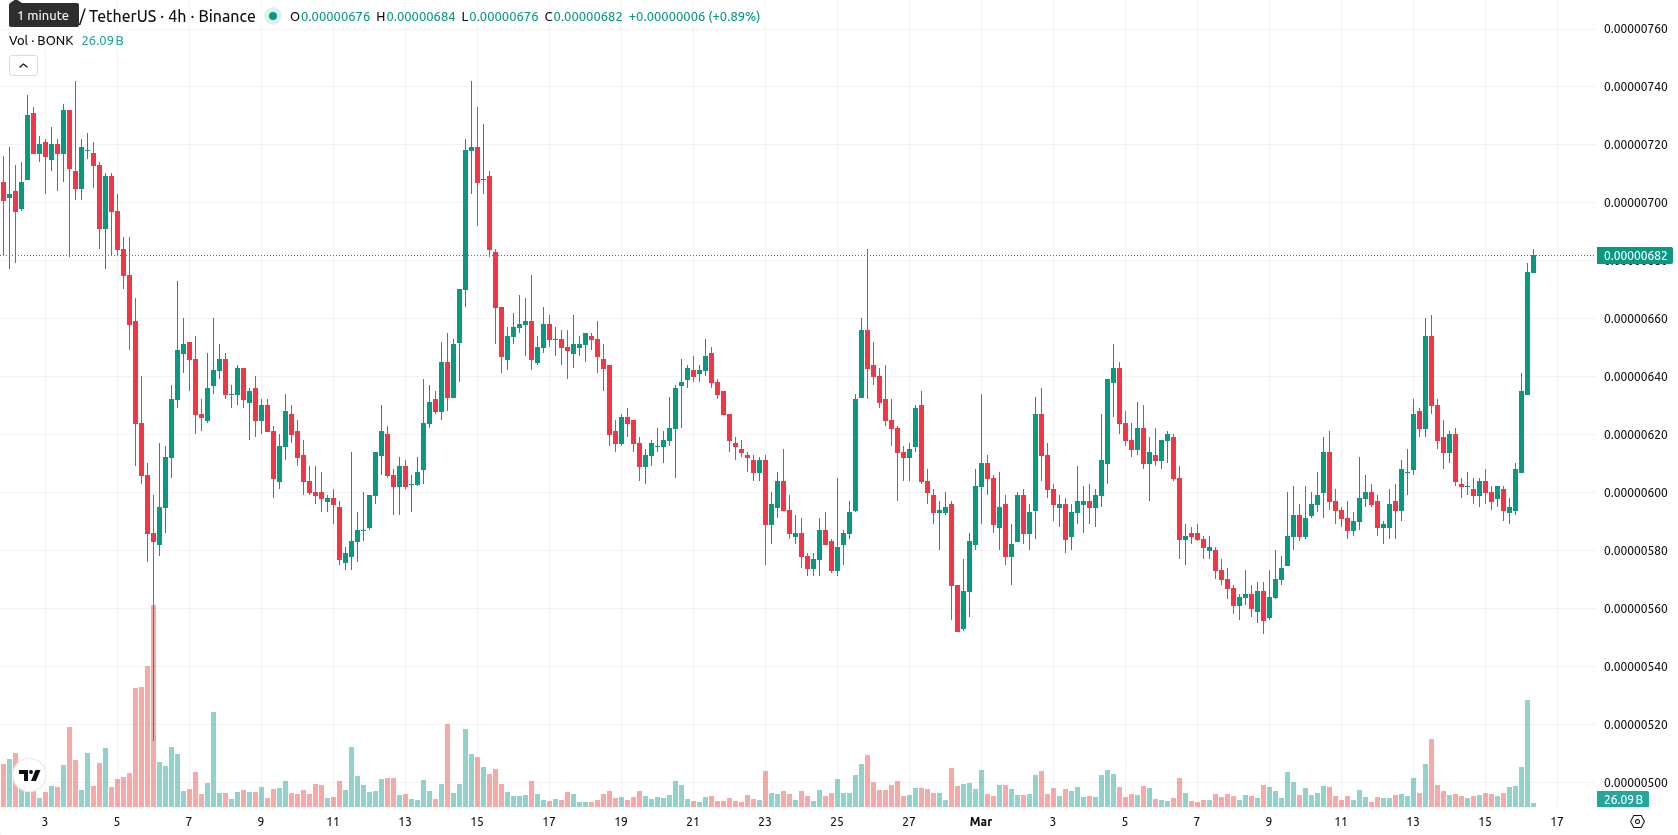
Bonk (BONK) is trading at $0.0000068, above the SMA-20 at $0.00000597 and slightly above the SMA-50 at $0.00000651, but far below the SMA-200 at $0.00001210, indicating short- and medium-term bullish momentum but persistent long-term bearish pressure. The Ichimoku Kijun level at $0.00000617 sits below price, marking immediate support.
Highlights
- BONK shows short-term bullish momentum but faces persistent long-term bearish pressure according to prevailing technical trends.
- Momentum indicators present mixed signals, with intraday buying strength not fully supported by broader daily indicators.
- Expect BONK to trade between $0.00000610 and $0.00000710 next week, with downside risk favored and bullish breakout unlikely unless closing above $0.00000685.
Intraday bullish divergence as daily momentum signals weaken
Momentum readings show conflicting signals: while the ADX is neutral on D1, the MACD suggests strong bearishness, and the RSI indicates mild selling pressure at 46.7. Stoch RSI and CCI are both neutral, yet intraday BBP is positive, signaling buyer dominance. The daily price jumped 13.23% with no gap between sessions, with BONK trading near the high of the day’s range and seeing high volatility after the open, reflecting strong intraday bullish tone. These intraday gains are not fully supported by D1 momentum indicators, highlighting a divergence between short-term buying pressure and the broader technical backdrop.
Downside risk prevails amid limited breakout potential
For the coming week, expect BONK to trade between $0.00000610 and $0.00000710, representing a typical volatility band relative to current levels. The probability of further price increase is very low (less than 20%), making a decline more likely as suggested by the persistent weekly downtrend in SMA-50, MACD, and RSI. Baseline scenario calls for sideways trading within this band. A bullish breakout would require closing decisively above $0.00000685, targeting the $0.00000710 area. A bearish move below $0.00000610 would expose BONK to renewed downside risk.
Earlier, analysts noted that Bonk’s upward moves were tempered by mixed momentum indicators and weakening market activity, casting doubt on the sustainability of short-term rallies. The latest analysis reinforces this caution, emphasizing that unless BONK can decisively close above $0.00000685, the prevailing risk remains to the downside within the projected volatility band.


Latest Bonk News


-
 Afghanistan
-
 Albania
-
 Algeria
-
 Angola
-
 Argentina
-
 Armenia
-
 Australia
-
 Austria
-
 Azerbaijan
-
 Bahamas
-
 Bahrain
-
 Bangladesh
-
 Belarus
-
 Belgium
-
 Bolivia
-
 Botswana
-
 Brazil
-
 Brunei
-
 Bulgaria
-
 Cambodia
-
 Cameroon
-
 Canada
-
 Chile
Chile
-
 China
China
-
 Colombia
-
 Congo
Congo
-
 Costa Rica
-
 Cote d'Ivoire
-
 Croatia
-
 Cuba
Cuba
-
 Cyprus
-
 Czechia
-
 DR Congo
-
 Denmark
-
 Dominican Republic
-
 Ecuador
-
 Egypt
Egypt
-
 El Salvador
-
 Estonia
-
 Eswatini
-
 Ethiopia
-
 Finland
-
 France
-
 Georgia
-
 Germany
-
 Ghana
Ghana
-
 Greece
-
 Haiti
Haiti
-
 Hong Kong
-
 Hungary
-
 India
India
-
 Indonesia
-
 Iran, Islamic republic
-
 Iraq
Iraq
-
 Ireland
-
 Israel
-
 Italy
Italy
-
 Jamaica
-
 Japan
Japan
-
 Jordan
-
 Kazakhstan
-
 Kenya
Kenya
-
 Korea
Korea
-
 Kuwait
-
 Kyrgyzstan
-
 Laos
Laos
-
 Latvia
-
 Lebanon
-
 Lesotho
-
 Libya
Libya
-
 Lithuania
-
 Luxembourg
-
 Madagascar
-
 Malaysia
-
 Malta
Malta
-
 Mauritius
-
 Mexico
-
 Moldova
-
 Mongolia
-
 Montenegro
-
 Morocco
-
 Mozambique
-
 Myanmar
-
 Namibia
-
 Nepal
Nepal
-
 Netherlands
-
 New Zealand
-
 Nigeria
-
 North Macedonia
-
 Norway
-
 Oman
Oman
-
 Pakistan
-
 Palestine
-
 Panama
-
 Papua New Guinea
-
 Paraguay
-
 Peru
Peru
-
 Philippines
-
 Poland
-
 Portugal
-
 Puerto Rico
-
 Qatar
Qatar
-
 Reunion
-
 Romania
-
 Rwanda
-
 Saudi Arabia
-
 Serbia
-
 Singapore
-
 Slovakia
-
 Slovenia
-
 Somalia
-
 South Africa
-
 Spain
Spain
-
 Sri Lanka
-
 Sweden
-
 Switzerland
-
 Syria
Syria
-
 Taiwan
-
 Tajikistan
-
 Tanzania
-
 Thailand
-
 Trinidad and Tobago
-
 Tunisia
-
 Turkey
-
 UAE
UAE
-
 Uganda
-
 Ukraine
-
 United Kingdom
-
United States
-
 Uruguay
-
 Uzbekistan
-
 Venezuela
-
 Vietnam
-
 Yemen
Yemen
-
 Zambia
-
 Zimbabwe
- Forex
- Crypto
