
Raydium price prediction: Will oversold signals trigger reversal? RAY faces more losses

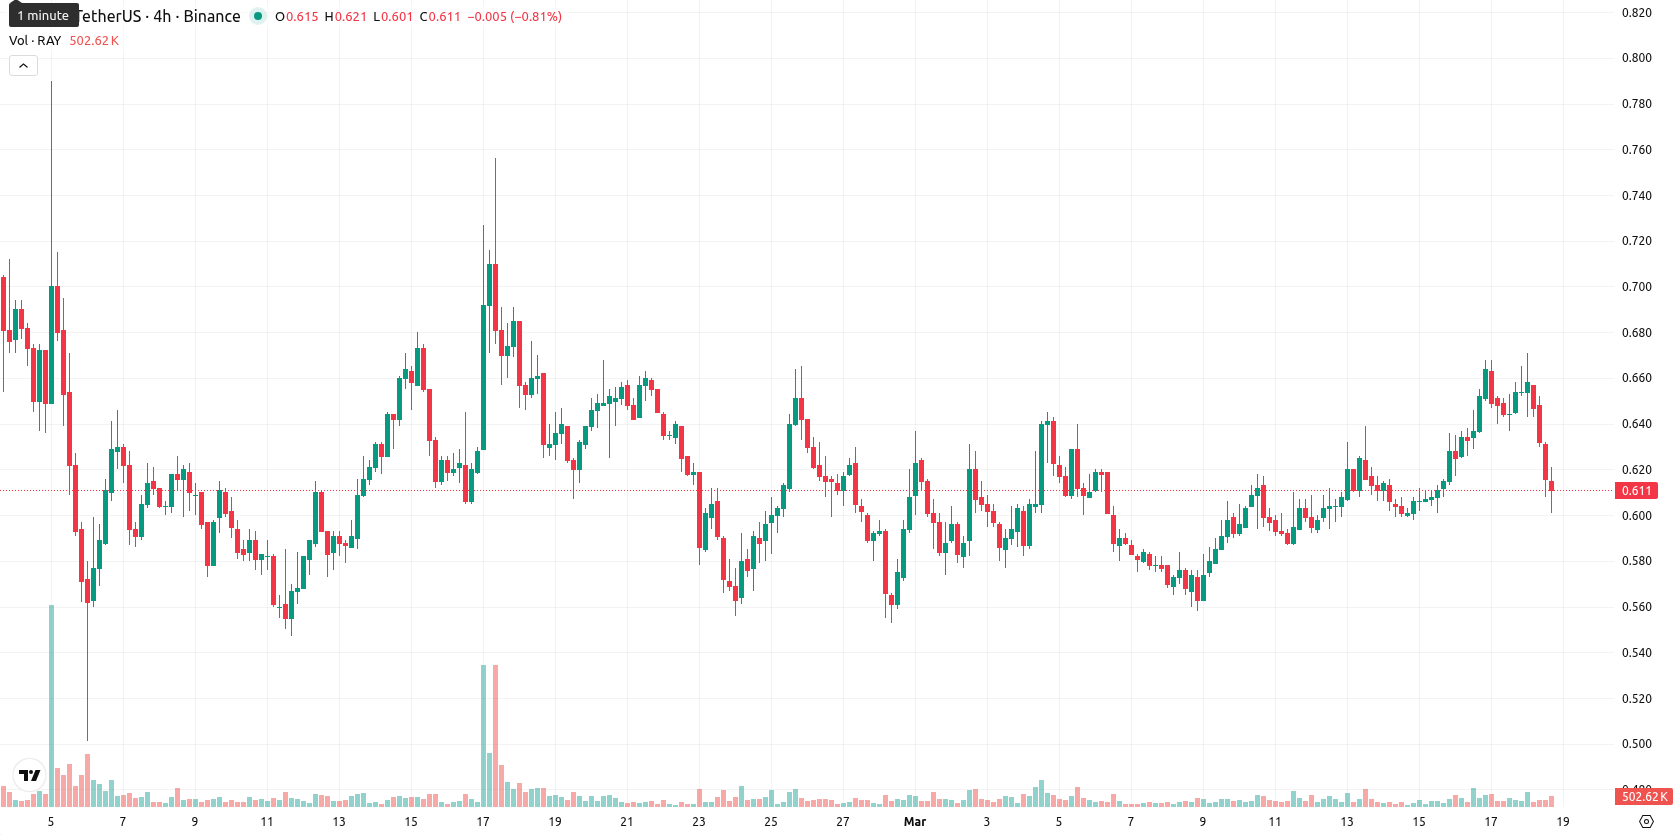
Raydium (RAY) is trading at $0.61 after a 7.15% decline, positioning it just above the SMA-20 ($0.6065), below the SMA-50 ($0.6499), and considerably under the SMA-200 ($1.4926). This setup implies limited short-term support but continued bearishness in the medium and long term.
Highlights
- Tianrong Internet Products and Services launched the beta of its decentralized AI inference marketplace DEPINfer, integrating Solana-based $DEPIN token utilities.
- Current beta phase prioritizes onboarding GPU contributors, validating referral mechanics, and establishing pay-to-earn governance for $DEPIN holders.
- RAY trades in a bearish trend with a likely price range of $0.58–$0.67, weakened by sustained selling pressure and negative momentum indicators.
Market utility tested as DEPINfer launches amid sustained selling
Tianrong Internet Products and Services Inc. announced the official Beta launch of its DEPINfer website, a decentralized AI inference marketplace powered by the Solana-based $DEPIN token, which is currently available on Raydium. This launch phase focuses on validating referral mechanics, onboarding GPU contributors, and demonstrating the pay-to-earn-govern utility model of $DEPIN. Upcoming features include staking, incentive allocation, token buybacks, burns, and decentralized governance by token holders, though price action has remained under broader selling pressure.
Bearish momentum deepens as support erodes and divergences widen
Technically, RAY finds minor support near the SMA-20 and faces immediate resistance at the nearby Ichimoku Kijun D1 level ($0.6105), remaining below both the SMA-50 and SMA-200, which underscores dominant medium- and long-term bearish trends. Momentum is weak, with MACD D1 and W1 signaling a strong sell and ADX D1 low at 10.75, while RSI D1 is mildly positive at 55.7. Divergences appear as Stoch RSI and CCI indicate overbought levels against the bearish MACD and ongoing downtrend, and BBP D1 registers slightly positive but subdued. Price has dropped sharply since the open and is near today's low ($0.601), reflecting high volatility and persistent intraday selling.
Further losses favored as volatility persists and downside risk mounts
In the short term, the typical volatility band for RAY is estimated at $0.58 – $0.67, keeping current levels at the center. There is a high likelihood (over 80%) of further downside, as both D1 and W1 momentum and trend indicators remain bearish. Continued sideways trading within the $0.58 to $0.67 range is forecast as the baseline scenario. A move above $0.67 would require a reversal of momentum, while a break below $0.58 could open further downside toward previous support levels.
Earlier, analysts noted that Raydium was experiencing short-term bullish momentum but faced risks of a pullback due to persistent overbought conditions and strong overhead resistance. The latest developments and continued bearish indicator signals now reinforce a cautionary stance, highlighting that traders should closely monitor the $0.58 support for potential downside acceleration if current weakness persists.


-
 Afghanistan
-
 Albania
-
 Algeria
-
 Angola
-
 Argentina
-
 Armenia
-
 Australia
-
 Austria
-
 Azerbaijan
-
 Bahamas
-
 Bahrain
-
 Bangladesh
-
 Belarus
-
 Belgium
-
 Bolivia
-
 Botswana
-
 Brazil
-
 Brunei
-
 Bulgaria
-
 Cambodia
-
 Cameroon
-
 Canada
-
 Chile
Chile
-
 China
China
-
 Colombia
-
 Congo
Congo
-
 Costa Rica
-
 Cote d'Ivoire
-
 Croatia
-
 Cuba
Cuba
-
 Cyprus
-
 Czechia
-
 DR Congo
-
 Denmark
-
 Dominican Republic
-
 Ecuador
-
 Egypt
Egypt
-
 El Salvador
-
 Estonia
-
 Eswatini
-
 Ethiopia
-
 Finland
-
 France
-
 Georgia
-
 Germany
-
 Ghana
Ghana
-
 Greece
-
 Haiti
Haiti
-
 Hong Kong
-
 Hungary
-
 India
India
-
 Indonesia
-
 Iran, Islamic republic
-
 Iraq
Iraq
-
 Ireland
-
 Israel
-
 Italy
Italy
-
 Jamaica
-
 Japan
Japan
-
 Jordan
-
 Kazakhstan
-
 Kenya
Kenya
-
 Korea
Korea
-
 Kuwait
-
 Kyrgyzstan
-
 Laos
Laos
-
 Latvia
-
 Lebanon
-
 Lesotho
-
 Libya
Libya
-
 Lithuania
-
 Luxembourg
-
 Madagascar
-
 Malaysia
-
 Malta
Malta
-
 Mauritius
-
 Mexico
-
 Moldova
-
 Mongolia
-
 Montenegro
-
 Morocco
-
 Mozambique
-
 Myanmar
-
 Namibia
-
 Nepal
Nepal
-
 Netherlands
-
 New Zealand
-
 Nigeria
-
 North Macedonia
-
 Norway
-
 Oman
Oman
-
 Pakistan
-
 Palestine
-
 Panama
-
 Papua New Guinea
-
 Paraguay
-
 Peru
Peru
-
 Philippines
-
 Poland
-
 Portugal
-
 Puerto Rico
-
 Qatar
Qatar
-
 Reunion
-
 Romania
-
 Rwanda
-
 Saudi Arabia
-
 Serbia
-
 Singapore
-
 Slovakia
-
 Slovenia
-
 Somalia
-
 South Africa
-
 Spain
Spain
-
 Sri Lanka
-
 Sweden
-
 Switzerland
-
 Syria
Syria
-
 Taiwan
-
 Tajikistan
-
 Tanzania
-
 Thailand
-
 Trinidad and Tobago
-
 Tunisia
-
 Turkey
-
 UAE
UAE
-
 Uganda
-
 Ukraine
-
 United Kingdom
-
United States
-
 Uruguay
-
 Uzbekistan
-
 Venezuela
-
 Vietnam
-
 Yemen
Yemen
-
 Zambia
-
 Zimbabwe
- Forex
- Crypto
