
Theta: Strengthening bearish trend triggers a sharp decline

Theta (THETA) is trading at $0.175 after a drop of 7.41% for the session, positioning the asset below its MA-20 ($0.1847500), MA-50 ($0.1992400), and MA-200 ($0.4143350). The current price is well under the Ichimoku Kijun resistance at $0.1920000, reflecting sustained downside pressure across all major timeframes.
Highlights
- THETA is under sustained downward pressure, trading below key moving averages across short, medium, and long-term timeframes.
- Technical momentum and oscillators align on a strong bearish trend, with little evidence of an imminent reversal.
- THETA's expected range for the next five days is $0.170–$0.180, with a higher likelihood of further downside if $0.170 support fails.
Bearish momentum intensifies as sellers drive intraday volatility
Momentum indicators on the daily chart are decisively bearish — MACD shows a strong sell signal and ADX at 26.6 points to a strengthening downward trend. RSI is at 42.96, leaning bearish, while Stoch RSI at 56.6 is trending lower, and CCI remains neutral near the lower range. BBP is marginally positive, but its trend has turned bearish, suggesting sellers dominate intraday. The Awesome Oscillator supports the bearish momentum. THETA has traded within a session range of $0.175 to $0.181 following a gap down at the open, with price holding at the session's low and reflecting high intraday volatility.
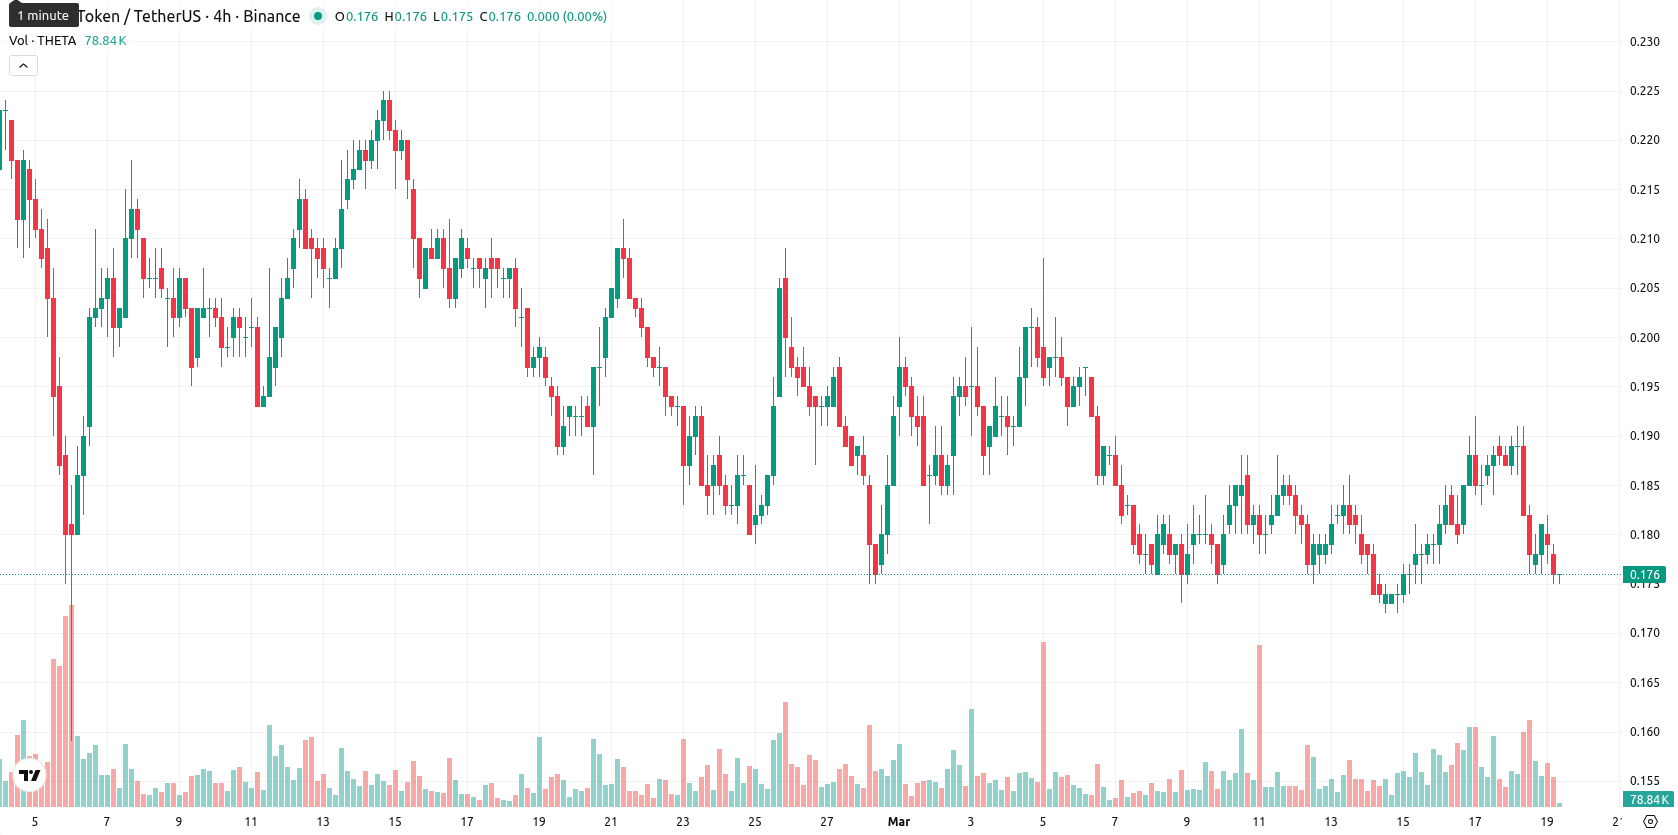
Consolidation expected as downside risk dominates outlook
For the next 5 trading days, THETA is expected to consolidate within a typical volatility band of $0.170–$0.180. The probability of a price increase is very low (less than 20%), while further decline is more likely based on trend indicators from both daily and weekly timeframes. The baseline scenario sees sideways movement between support at $0.170 and resistance at $0.180. A decisive move above $0.192 would be required for a bullish reversal, while loss of support near $0.170 may accelerate the downtrend.
Previously it was reported that Theta remained under notable bearish pressure, with technical indicators signaling persistent downside momentum and limited prospects for a near-term recovery. The latest analysis reinforces this negative outlook, highlighting that traders should closely monitor the $0.170 support level as a break below it may trigger an accelerated decline.


Latest Theta News


-
 Afghanistan
-
 Albania
-
 Algeria
-
 Angola
-
 Argentina
-
 Armenia
-
 Australia
-
 Austria
-
 Azerbaijan
-
 Bahamas
-
 Bahrain
-
 Bangladesh
-
 Belarus
-
 Belgium
-
 Bolivia
-
 Botswana
-
 Brazil
-
 Brunei
-
 Bulgaria
-
 Cambodia
-
 Cameroon
-
 Canada
-
 Chile
Chile
-
 China
China
-
 Colombia
-
 Congo
Congo
-
 Costa Rica
-
 Cote d'Ivoire
-
 Croatia
-
 Cuba
Cuba
-
 Cyprus
-
 Czechia
-
 DR Congo
-
 Denmark
-
 Dominican Republic
-
 Ecuador
-
 Egypt
Egypt
-
 El Salvador
-
 Estonia
-
 Eswatini
-
 Ethiopia
-
 Finland
-
 France
-
 Georgia
-
 Germany
-
 Ghana
Ghana
-
 Greece
-
 Haiti
Haiti
-
 Hong Kong
-
 Hungary
-
 India
India
-
 Indonesia
-
 Iran, Islamic republic
-
 Iraq
Iraq
-
 Ireland
-
 Israel
-
 Italy
Italy
-
 Jamaica
-
 Japan
Japan
-
 Jordan
-
 Kazakhstan
-
 Kenya
Kenya
-
 Korea
Korea
-
 Kuwait
-
 Kyrgyzstan
-
 Laos
Laos
-
 Latvia
-
 Lebanon
-
 Lesotho
-
 Libya
Libya
-
 Lithuania
-
 Luxembourg
-
 Madagascar
-
 Malaysia
-
 Malta
Malta
-
 Mauritius
-
 Mexico
-
 Moldova
-
 Mongolia
-
 Montenegro
-
 Morocco
-
 Mozambique
-
 Myanmar
-
 Namibia
-
 Nepal
Nepal
-
 Netherlands
-
 New Zealand
-
 Nigeria
-
 North Macedonia
-
 Norway
-
 Oman
Oman
-
 Pakistan
-
 Palestine
-
 Panama
-
 Papua New Guinea
-
 Paraguay
-
 Peru
Peru
-
 Philippines
-
 Poland
-
 Portugal
-
 Puerto Rico
-
 Qatar
Qatar
-
 Reunion
-
 Romania
-
 Rwanda
-
 Saudi Arabia
-
 Serbia
-
 Singapore
-
 Slovakia
-
 Slovenia
-
 Somalia
-
 South Africa
-
 Spain
Spain
-
 Sri Lanka
-
 Sweden
-
 Switzerland
-
 Syria
Syria
-
 Taiwan
-
 Tajikistan
-
 Tanzania
-
 Thailand
-
 Trinidad and Tobago
-
 Tunisia
-
 Turkey
-
 UAE
UAE
-
 Uganda
-
 Ukraine
-
 United Kingdom
-
United States
-
 Uruguay
-
 Uzbekistan
-
 Venezuela
-
 Vietnam
-
 Yemen
Yemen
-
 Zambia
-
 Zimbabwe
- Forex
- Crypto
