
Walrus drops as conflicting daily indicators fuel market uncertainty

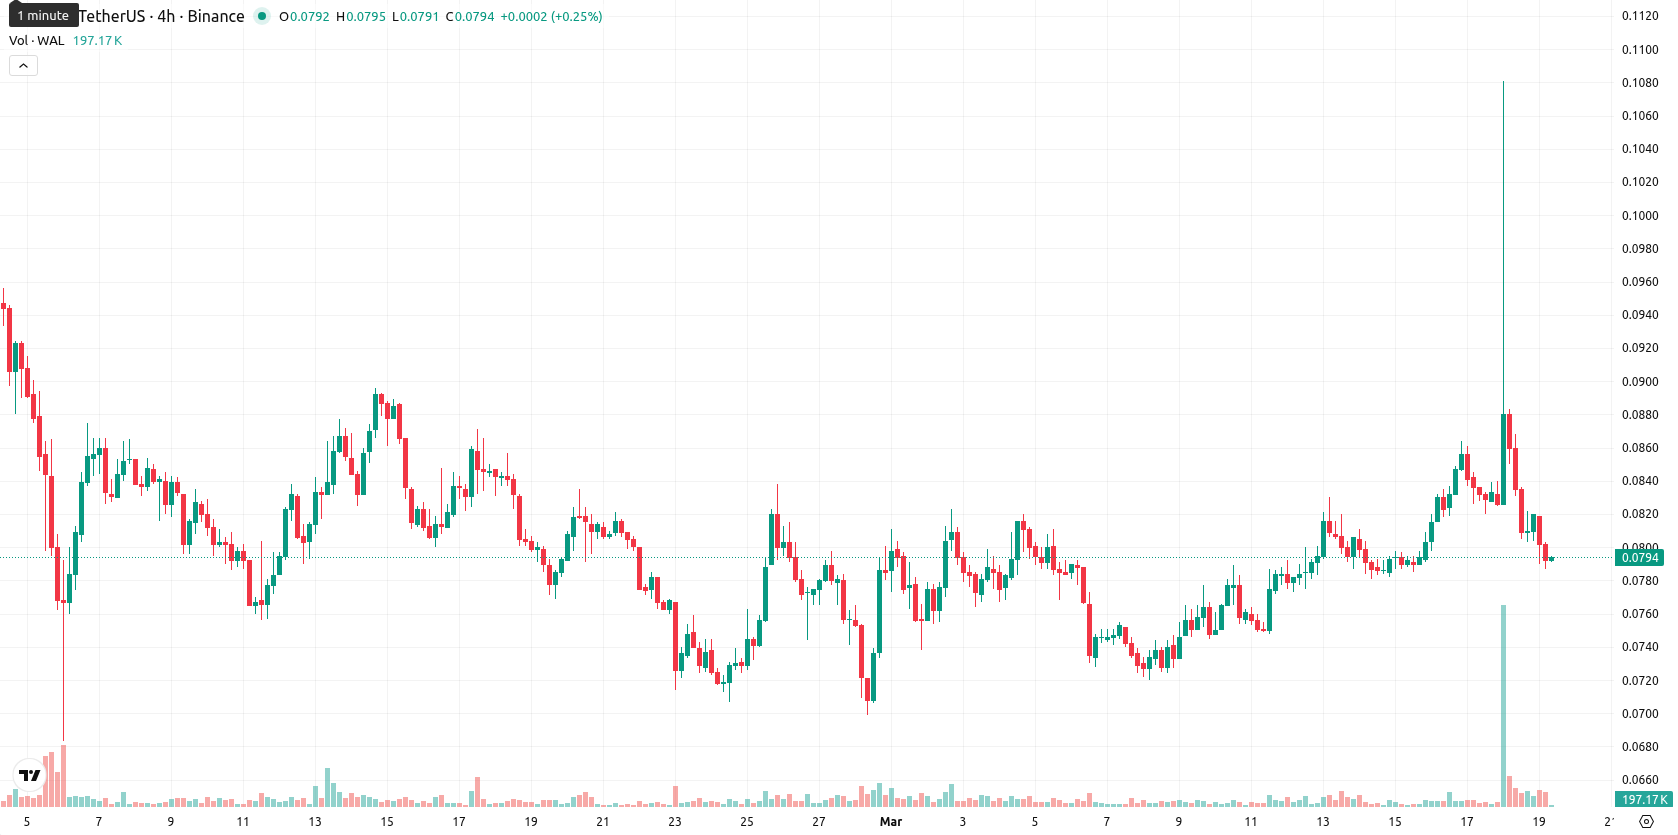
Walrus (WAL) is trading at $0.0791, positioned just above the SMA-20 ($0.0783), slightly below the SMA-50 ($0.0829), and well beneath the long-term SMA-200 ($0.1975), pointing to stabilization over the short-term but with ongoing bearish pressure for the medium and long term. The Ichimoku Kijun is at $0.0862 and acts as immediate resistance.
Highlights
- WAL remains in a medium- and long-term downtrend, trading below key moving averages and facing sustained bearish pressure.
- Recent price action shows high intraday volatility and dominance of short-term sellers, with the asset losing 8.24% today.
- With probability of upside below 20%, price is likely to trade sideways between $0.0770 and $0.0795 barring a break of current resistance.
Mixed signals and strong sell momentum as intraday sellers dominate
Momentum on the daily chart is mixed: MACD signals a strong sell, while ADX is in buy territory at moderate strength, highlighting divergence in trend conviction. RSI gives a buy signal and sits near neutral at 50, with CCI indicating overbought conditions, while Stoch RSI is neutral but oversold on most intraday timeframes. Bull/Bear Power (BBP) suggests buyer dominance on the daily but continued seller strength intraday. The Awesome Oscillator supports a short-term upward bias, but daily price action was unfavorable — WAL opened slightly lower without a significant gap and moved steadily down, losing 8.24% to settle near today's low of the $0.0787–$0.0820 range, amid high intraday volatility and clear downside pressure after the open. Divergence between daily and intraday momentum and oscillators underlines uncertainty and contradictory signals, with negative price action confirming the dominance of short-term sellers.
Sideways bias as weak momentum dims breakout prospects
Looking to the next five trading days, WAL is expected to remain within a $0.0770–$0.0795 volatility band relative to current levels. The likelihood of a short-term price increase is very low (less than 20%), with the base case scenario favoring sideways movement within this range. A bullish breakout would require a move above the $0.0862 resistance (Kijun), which currently appears unlikely given weak momentum. If selling pressure persists, a break below $0.0770 could extend the downward trend.
Earlier, analysts noted that Walrus exhibited mixed short- and medium-term momentum, with caution warranted due to conflicting technical signals and persistent downside risk. The latest data reinforce this cautious outlook, as renewed volatility and unfavorable price action highlight the importance of monitoring the $0.0770 support for signs of a potential downside extension in the coming sessions.


Latest Walrus News


-
 Afghanistan
-
 Albania
-
 Algeria
-
 Angola
-
 Argentina
-
 Armenia
-
 Australia
-
 Austria
-
 Azerbaijan
-
 Bahamas
-
 Bahrain
-
 Bangladesh
-
 Belarus
-
 Belgium
-
 Bolivia
-
 Botswana
-
 Brazil
-
 Brunei
-
 Bulgaria
-
 Cambodia
-
 Cameroon
-
 Canada
-
 Chile
Chile
-
 China
China
-
 Colombia
-
 Congo
Congo
-
 Costa Rica
-
 Cote d'Ivoire
-
 Croatia
-
 Cuba
Cuba
-
 Cyprus
-
 Czechia
-
 DR Congo
-
 Denmark
-
 Dominican Republic
-
 Ecuador
-
 Egypt
Egypt
-
 El Salvador
-
 Estonia
-
 Eswatini
-
 Ethiopia
-
 Finland
-
 France
-
 Georgia
-
 Germany
-
 Ghana
Ghana
-
 Greece
-
 Haiti
Haiti
-
 Hong Kong
-
 Hungary
-
 India
India
-
 Indonesia
-
 Iran, Islamic republic
-
 Iraq
Iraq
-
 Ireland
-
 Israel
-
 Italy
Italy
-
 Jamaica
-
 Japan
Japan
-
 Jordan
-
 Kazakhstan
-
 Kenya
Kenya
-
 Korea
Korea
-
 Kuwait
-
 Kyrgyzstan
-
 Laos
Laos
-
 Latvia
-
 Lebanon
-
 Lesotho
-
 Libya
Libya
-
 Lithuania
-
 Luxembourg
-
 Madagascar
-
 Malaysia
-
 Malta
Malta
-
 Mauritius
-
 Mexico
-
 Moldova
-
 Mongolia
-
 Montenegro
-
 Morocco
-
 Mozambique
-
 Myanmar
-
 Namibia
-
 Nepal
Nepal
-
 Netherlands
-
 New Zealand
-
 Nigeria
-
 North Macedonia
-
 Norway
-
 Oman
Oman
-
 Pakistan
-
 Palestine
-
 Panama
-
 Papua New Guinea
-
 Paraguay
-
 Peru
Peru
-
 Philippines
-
 Poland
-
 Portugal
-
 Puerto Rico
-
 Qatar
Qatar
-
 Reunion
-
 Romania
-
 Rwanda
-
 Saudi Arabia
-
 Serbia
-
 Singapore
-
 Slovakia
-
 Slovenia
-
 Somalia
-
 South Africa
-
 Spain
Spain
-
 Sri Lanka
-
 Sweden
-
 Switzerland
-
 Syria
Syria
-
 Taiwan
-
 Tajikistan
-
 Tanzania
-
 Thailand
-
 Trinidad and Tobago
-
 Tunisia
-
 Turkey
-
 UAE
UAE
-
 Uganda
-
 Ukraine
-
 United Kingdom
-
United States
-
 Uruguay
-
 Uzbekistan
-
 Venezuela
-
 Vietnam
-
 Yemen
Yemen
-
 Zambia
-
 Zimbabwe
- Forex
- Crypto
